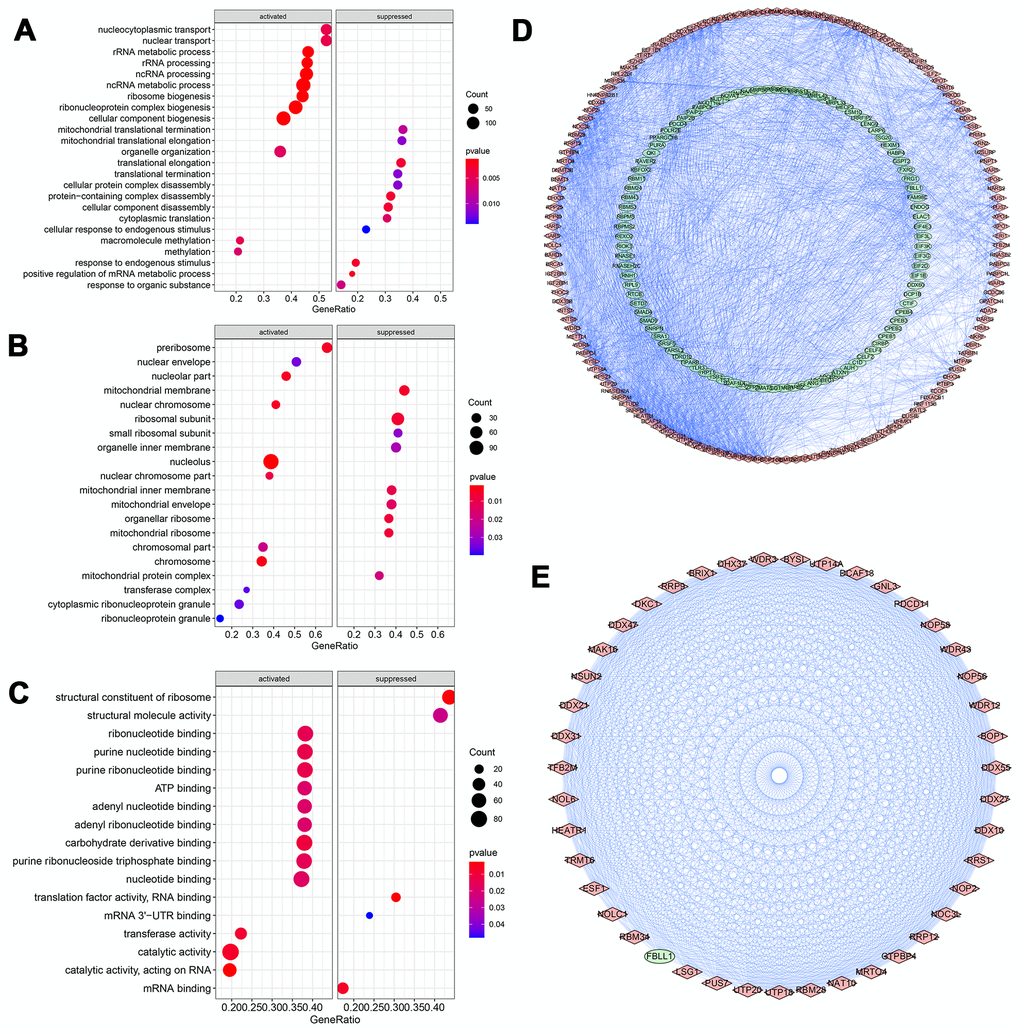
Figure 3.GO Enrichment analysis and protein-protein interaction (PPI) network of DERBPs. (A) Biological process; (B) Cellular component; (C) Molecular function; (D, E) PPI network of all and core module related DERBPs, respectively. Red and green nodes represent up- and down-regulated DERBPs, respectively.