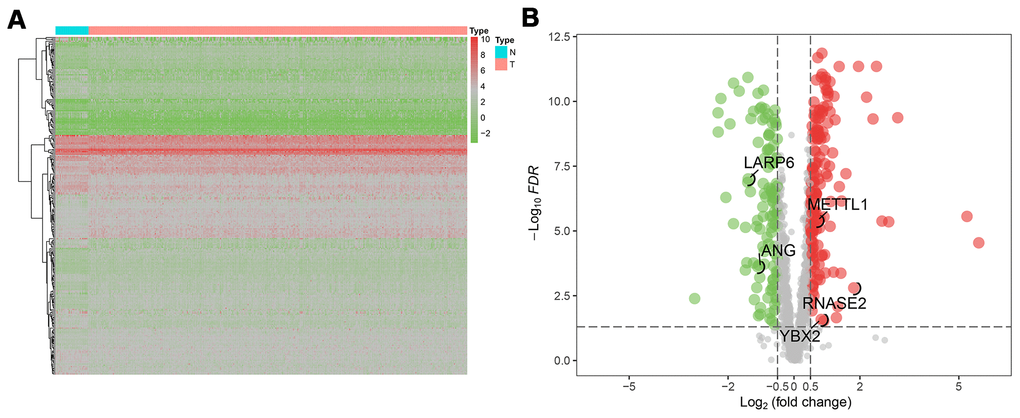
Figure 2.The differentially expressed RBPs (DERBPs) in gastric cancer using The Cancer Genome Atlas (TCGA) RNA sequencing data. (A) Heatmap of DERBPs; (B) Volcano plot. Up- and down-regulated genes are represented in red and green, respectively; FDR, false discovery rate.