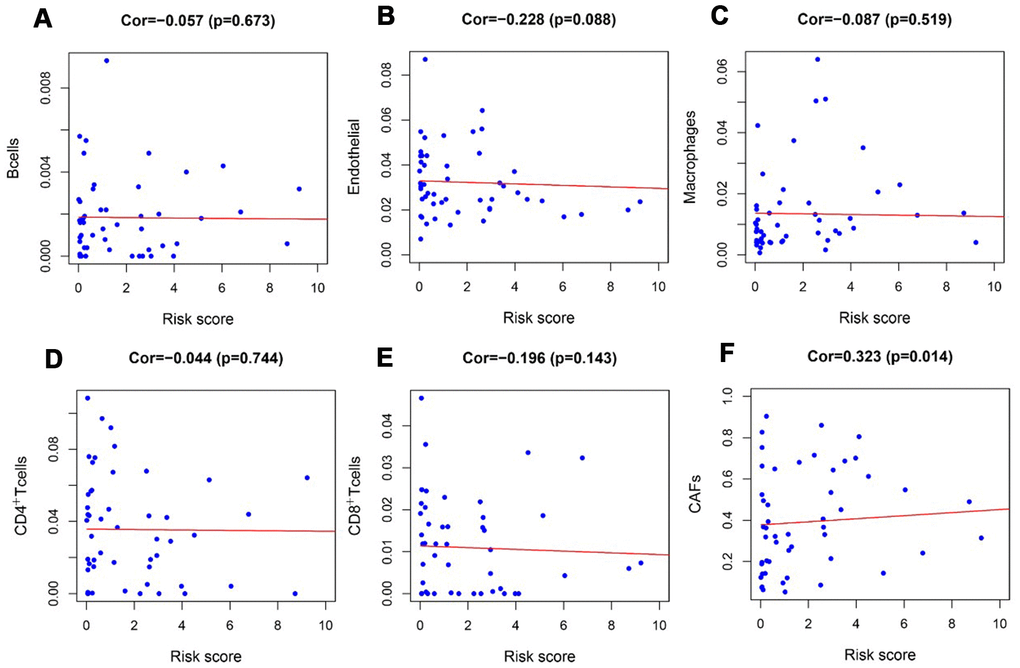
Figure 9.Analysis of the correlation between the risk score and tumor-infiltrating cells in the TARGET-RTK cohort. (A) B cells; (B) endothelial cells; (C) Macrophages. (D) CD4+ T cells. (E) CD8+ T cells. (F) CAFs. Abbreviation: CAFs, carcinoma-associated fibroblasts.