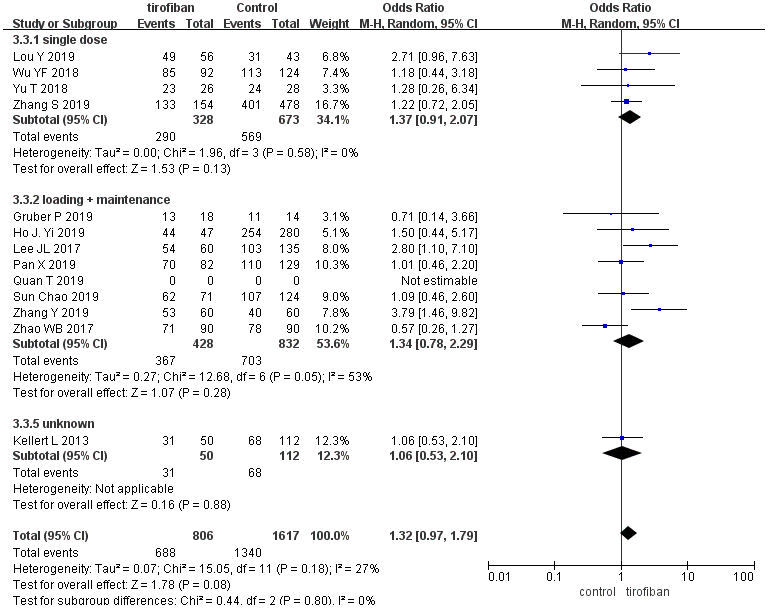
Figure 3.Forest plot comparing recanalization rates for EVT+ tirofiban vs. EVT. Included trials are divided into subgroups based on tirofiban administration strategy (single dose or loading dose plus maintenance doses). CI, confidence interval; Weight, statistical weight (an indirect estimate of study precision and impact on overall pooled estimates of the single study result).