Submit an Article
Navigate
Home
Editorial Board
Editorial Policies
Current Volume
Archive
Scientific Integrity
Publication Ethics Statements
Interviews with Outstanding Authors
Newsroom
Sponsored Conferences
Podcast
Contact
Special Collections
Submit an Article
Online ISSN: 1945-4589
Research Paper
|
Volume 13, Issue 4
|
pp. 5403–5414
RNF168 is highly expressed in esophageal squamous cell carcinoma and contributes to the malignant behaviors in association with the Wnt/β-catenin signaling pathway
Back to article
Figure 7
(7 of 7)
−
100%
+
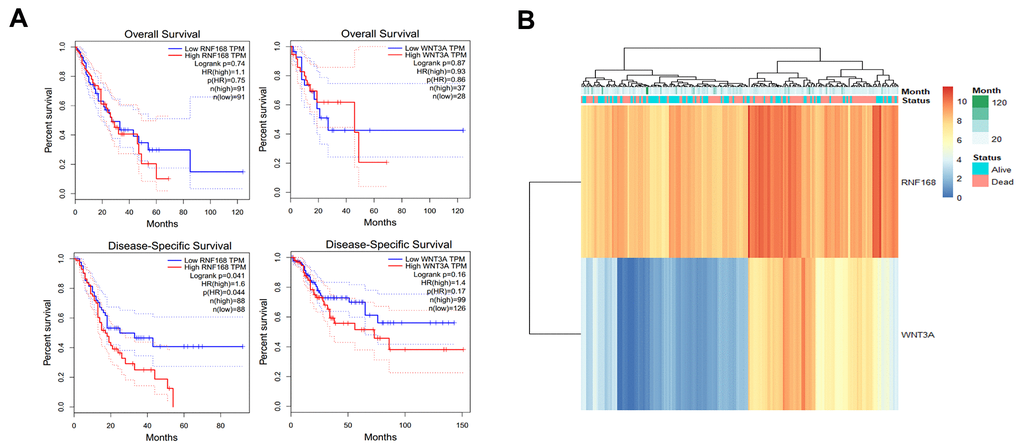
Figure 7.
(
A
) TCGA database analysis of RNF168 and WNT3A mRNA expression levels and OS and DSS curves in patients with esophageal squamous cell carcinoma; (
B
) heat maps showing WNT3A and RNF168 expression levels and survival in 184 patients.