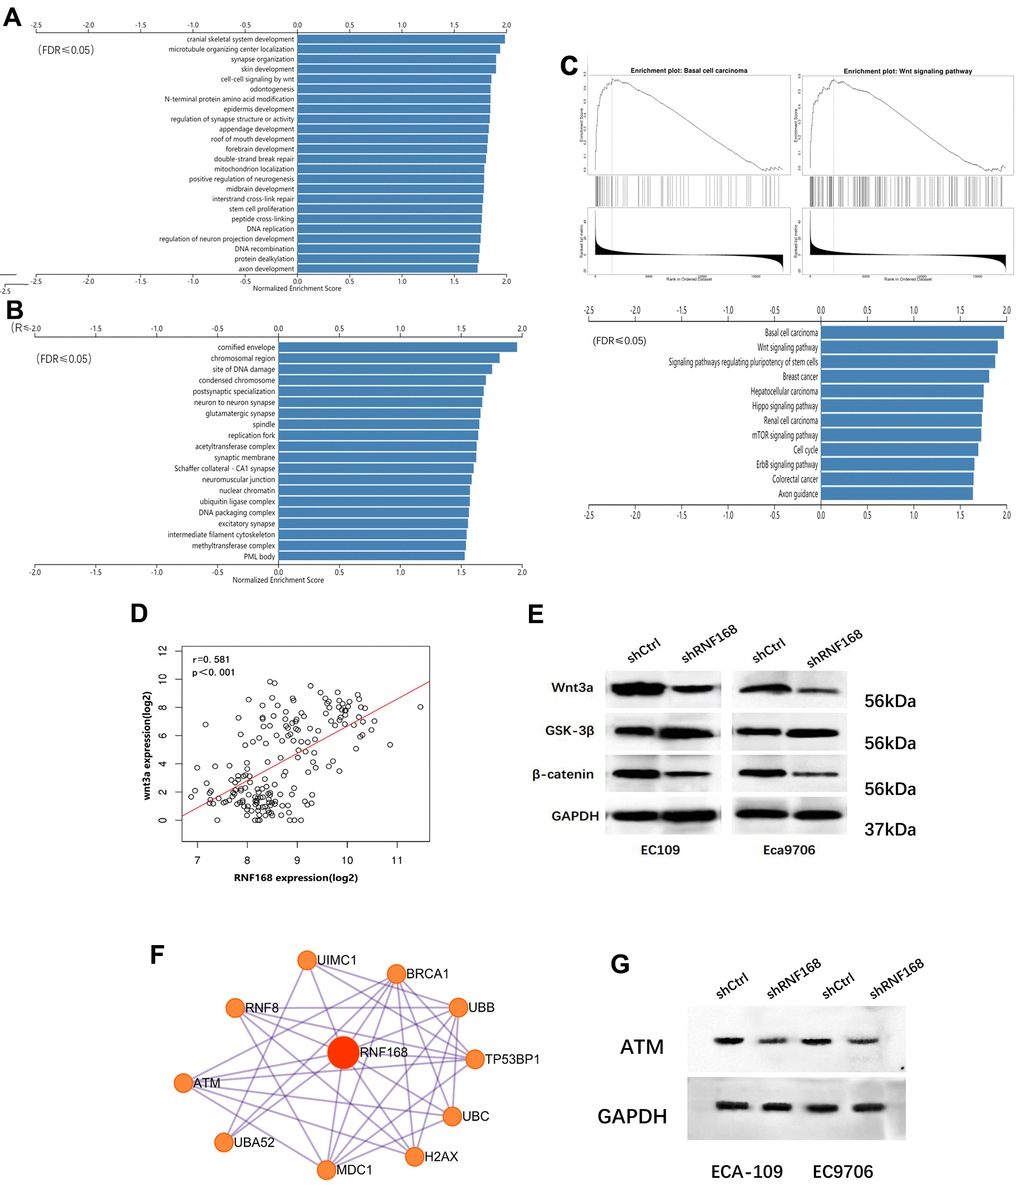
Figure 5.(A) and (B) Enrichment analysis of differentially expressed genes in 184 cases of esophageal cancer from the TCGA database; (C) Pathway enrichment analysis; (D) correlation between WNT3A and RNF168 mRNA levels; (E) Wnt/β-catenin signaling pathway protein component levels in ECA-109 and EC9706 cells after transduction; (F) PPI network for RNF168. (G) RNF168 and ATM expression by Western blot.