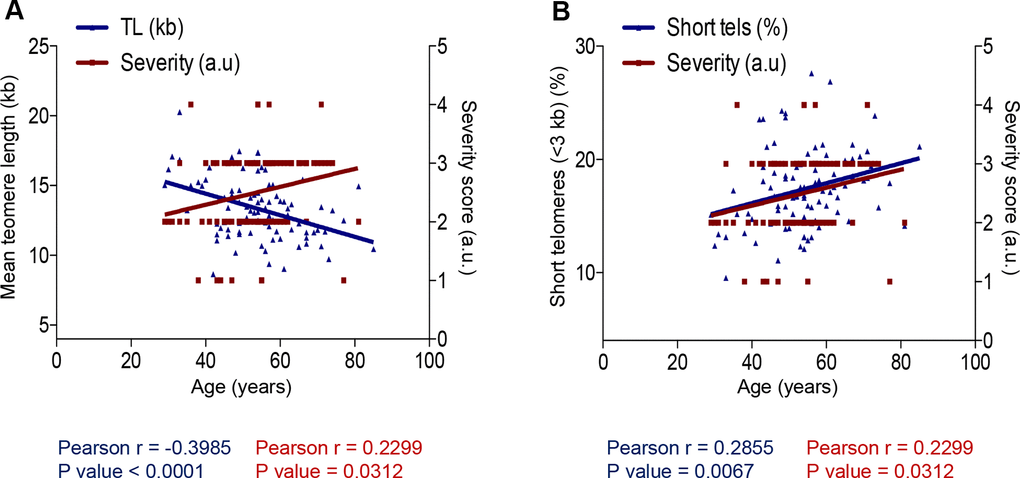
Figure 4.Correlation between age and COVID-19 severity and telomere length. (A, B) Person correlation analysis between age and telomere length measured by HT Q-FISH in PMBC samples (A) and with percentage of short telomeres (<3 kb). The severity score was established by assigning values of 1, 2, 3, 4 for mild, moderate, severe and acute, respectively (see Materials and Methods). The Pearson r coefficient and the P values are indicated.