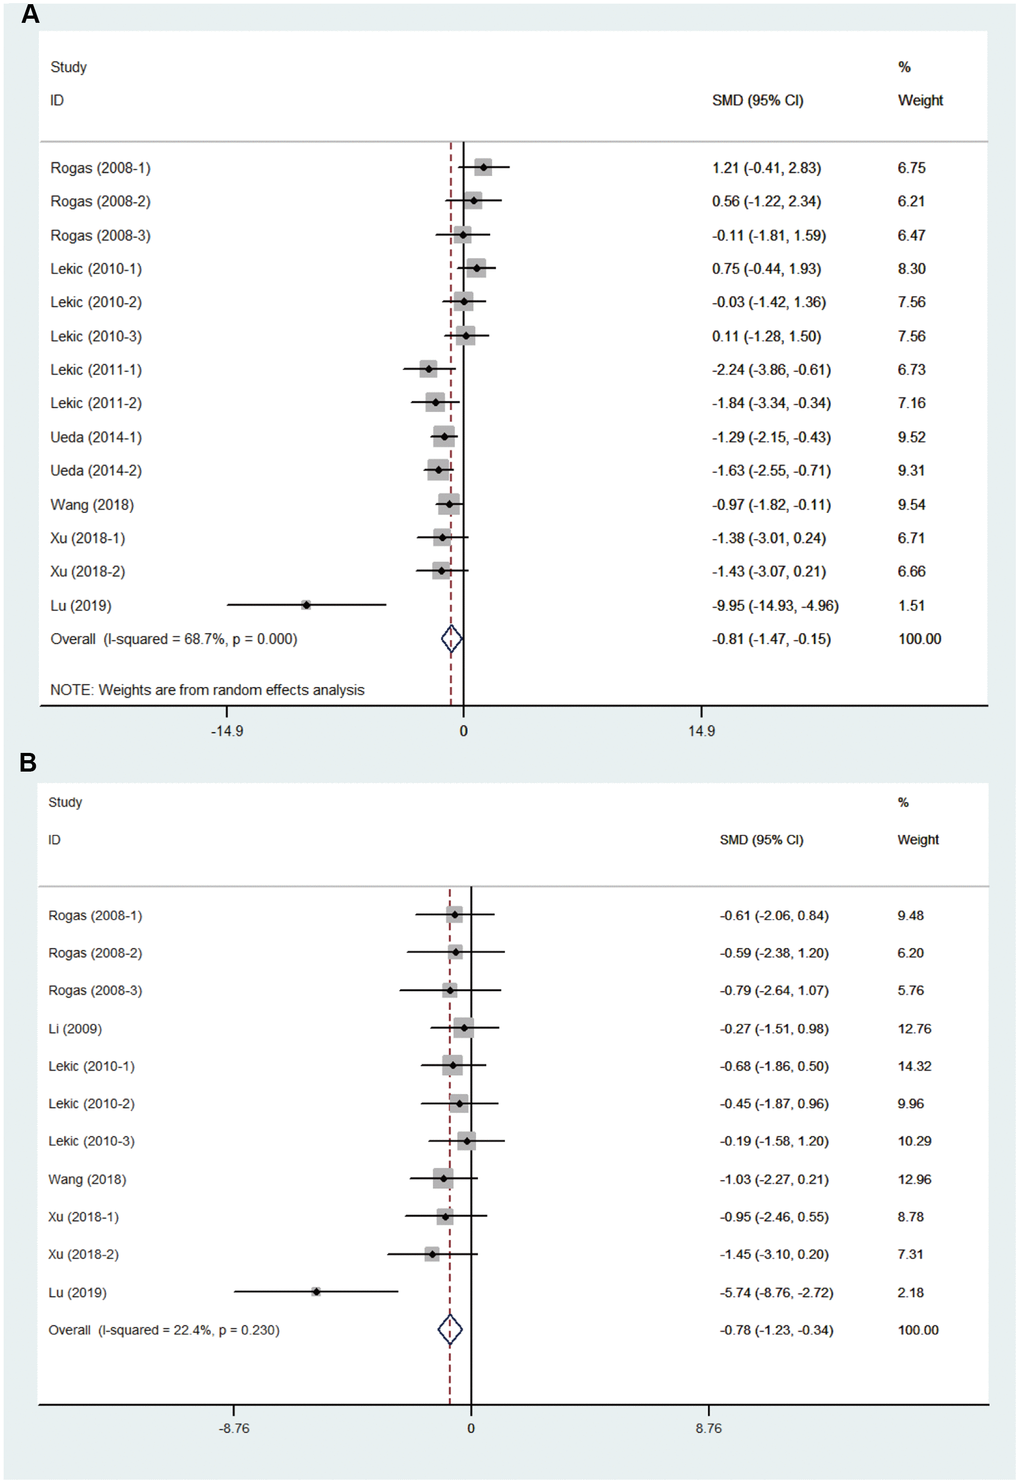
Figure 2.Effect size of included comparisons. Forest plot shows mean effect size and 95 % CI for (A) neurobehavioral outcomes and (B) brain water content.
Figure 2 — Efficacy of melatonin in animal models of intracerebral hemorrhage: a systematic review and meta-analysis | Aging