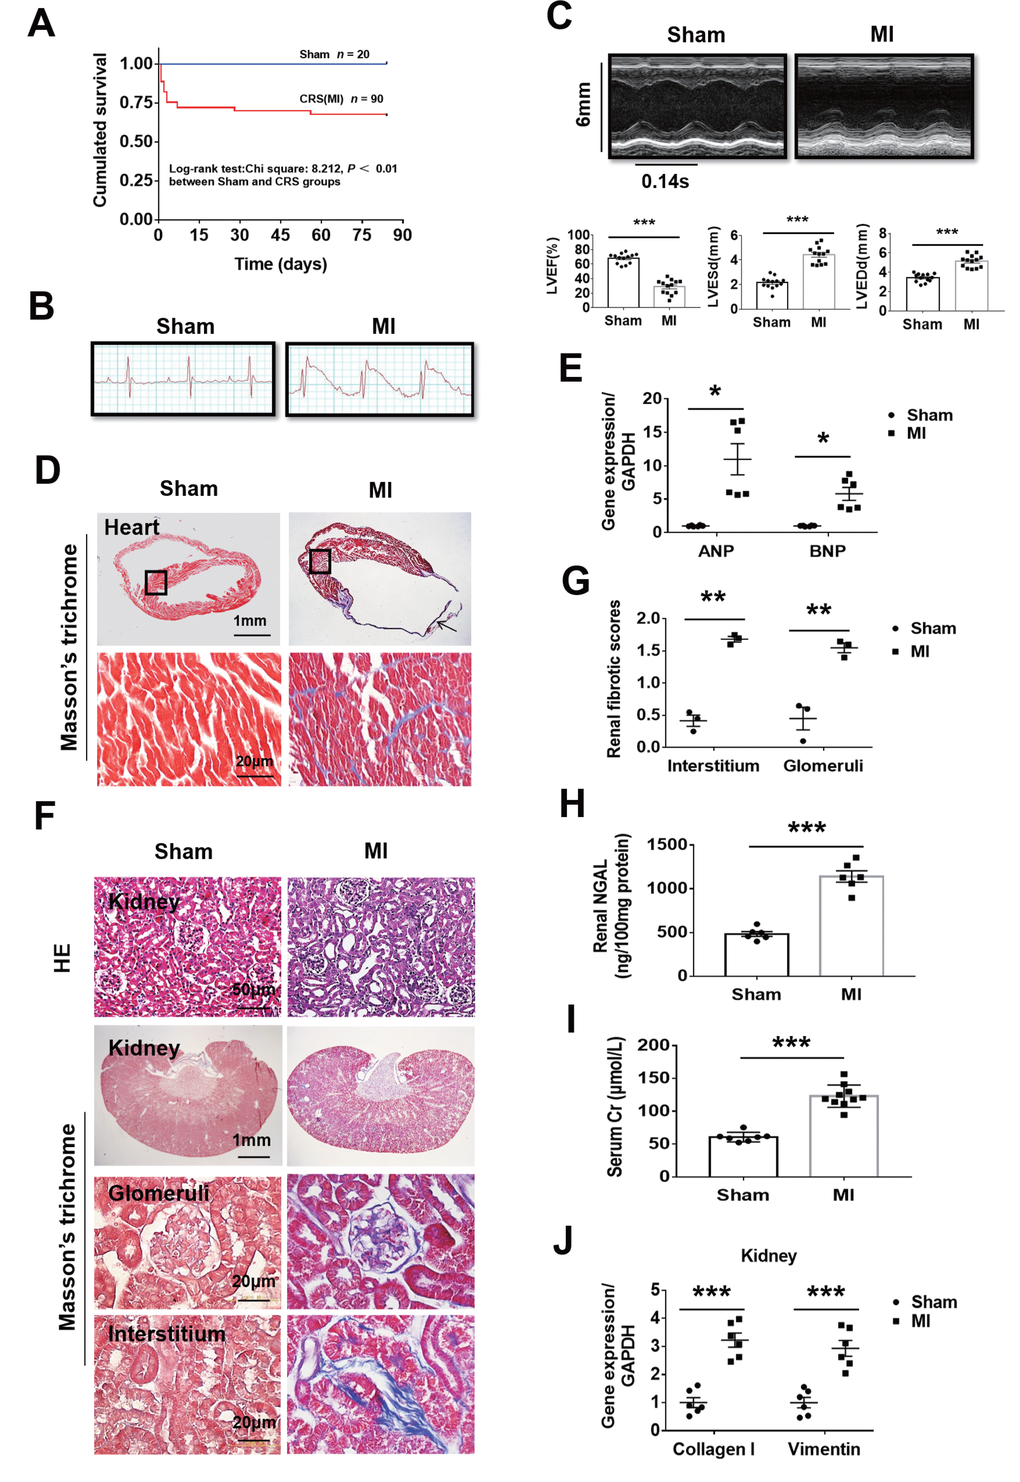
Figure 1.Fibrosis and dysfunction of the heart and kidneys in mice with cardiorenal syndrome (CRS) after surgically induced myocardial infarction (MI) at 12 weeks. (A) Survival rate for 12 weeks in Sham and CRS groups. (B) Representative electrocardiogram showing the ST-segment elevation in MI group. (C) Representative M-mode echocardiographic images. Left ventricular ejection fraction (LVEF), left ventricular end-systolic diameter (LVESd), and left ventricular end-diastolic diameter (LVEDd). ***P < 0.001 vs. sham mice, n = 13 per group. (D) Myocardial fibrosis detected by Masson’s trichrome staining in both the infarct zone (arrow) and the remote area (black frames). The lower panels are magnified views of the remote area (corresponding to black frames in the upper panels). (E) Quantitative real-time PCR for ANP and BNP mRNA in the heart. *P < 0.05 vs. sham mice, n = 6 per group. (F) Representative photomicrographs of hematoxylin-eosin staining (HE) and Masson-trichrome staining of kidney sections from sham and CRS groups show structural changes and fibrosis due to CRS. (G) Semi-quantitative analysis of renal fibrosis. **P < 0.01 vs. sham mice, n = 3 per group. (H) Renal NGAL level in renal tissue. (I) Serum creatinine level in mice measured by ELISA. For (H and I), ***P < 0.001 vs. sham mice, n = 6-10 per group. (J) Quantitative real-time PCR for Collagen I and Vimentin mRNA in the kidneys. ***P < 0.001 vs. sham mice, n = 6 per group. Data are means ± SE.