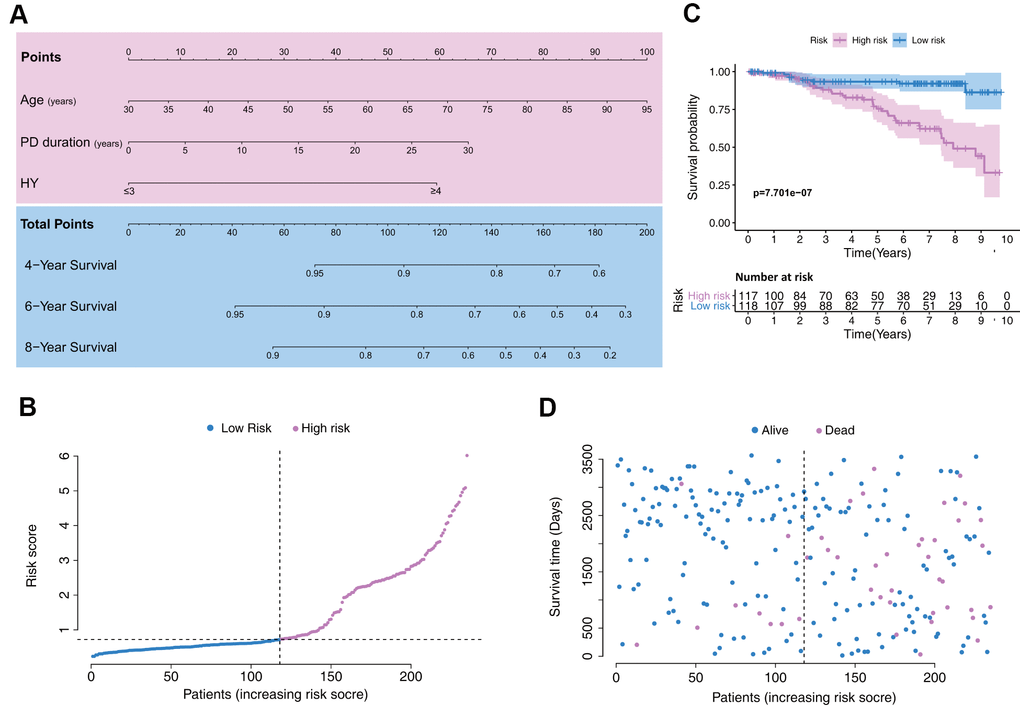
Figure 2.Establishment of a model with clinical indices to predict Parkinson’s disease survival. (A) A clinical feature model was used to develop a nomogram. (B) Distribution of the risk scores in the low- and high-risk groups. (C) Kaplan–Meier survival analysis between low- and high-risk groups. (D) Patient distribution in the low- and high-risk groups based on survival status.