Submit an Article
Navigate
Home
Editorial Board
Editorial Policies
Current Volume
Archive
Scientific Integrity
Publication Ethics Statements
Interviews with Outstanding Authors
Newsroom
Sponsored Conferences
Podcast
Contact
Special Collections
Submit an Article
Online ISSN: 1945-4589
Research Paper
|
Volume 13, Issue 4
|
pp. 5087–5103
Integrative transcriptomic and metabonomic profiling analyses reveal the molecular mechanism of Chinese traditional medicine huankuile suspension on TNBS-induced ulcerative colitis
Back to article
Figure 6
(6 of 8)
−
100%
+
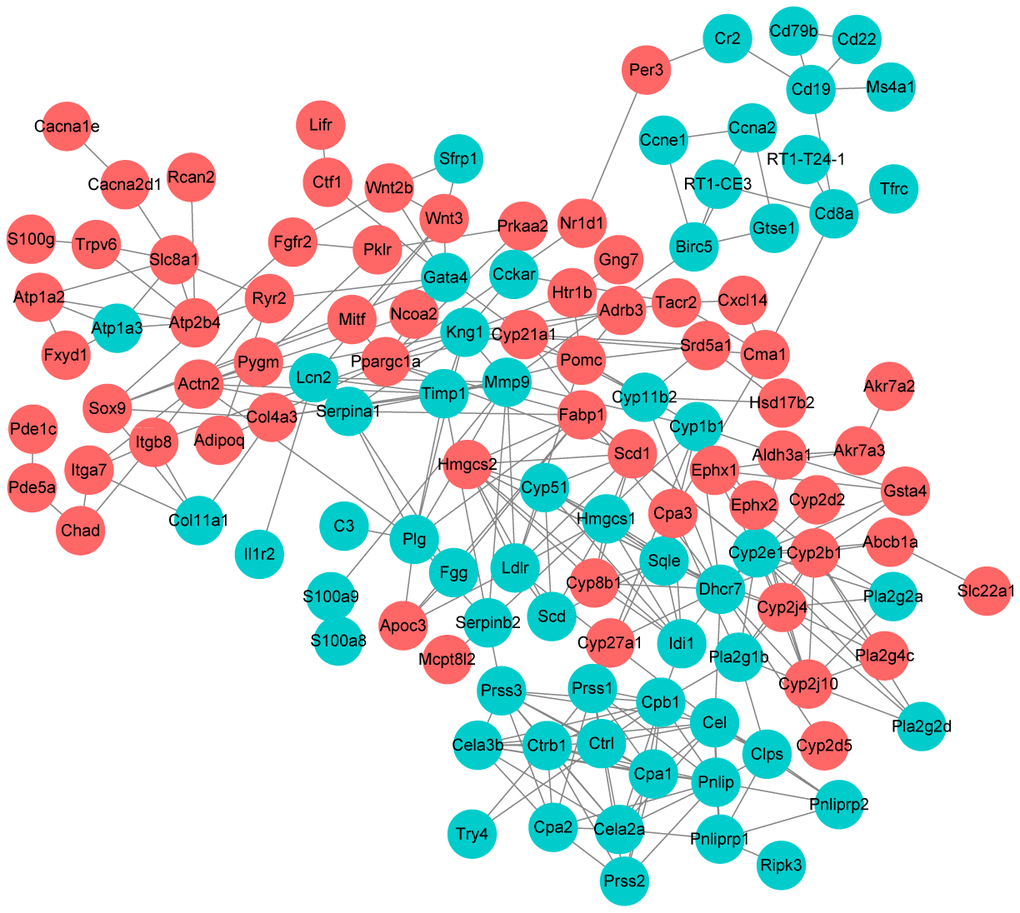
Figure 6.
Protein-protein interaction network construction.
Each node represents one differentially expressed protein. Each edge represents regulation. Red, up-regulated expressed protein; green, down-regulated expressed protein.