Submit an Article
Navigate
Home
Editorial Board
Editorial Policies
Current Volume
Archive
Scientific Integrity
Publication Ethics Statements
Interviews with Outstanding Authors
Newsroom
Sponsored Conferences
Podcast
Contact
Special Collections
Submit an Article
Online ISSN: 1945-4589
Research Paper
|
Volume 13, Issue 3
|
pp. 4605–4616
Resveratrol alleviates bleomycin-induced pulmonary fibrosis via suppressing HIF-1α and NF-κB expression
Back to article
Figure 4
(4 of 8)
−
100%
+
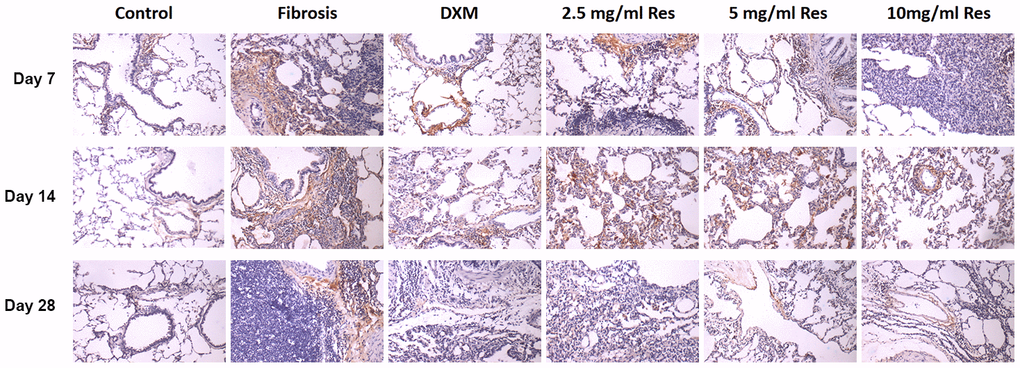
Figure 4.
HIF-1α was overexpressed in the rat fibrosis model.
The expression of HIF-1α was measured by immunohistochemistry on days 7, 14, and 28 following different treatments. Scale bar = 200 μm.