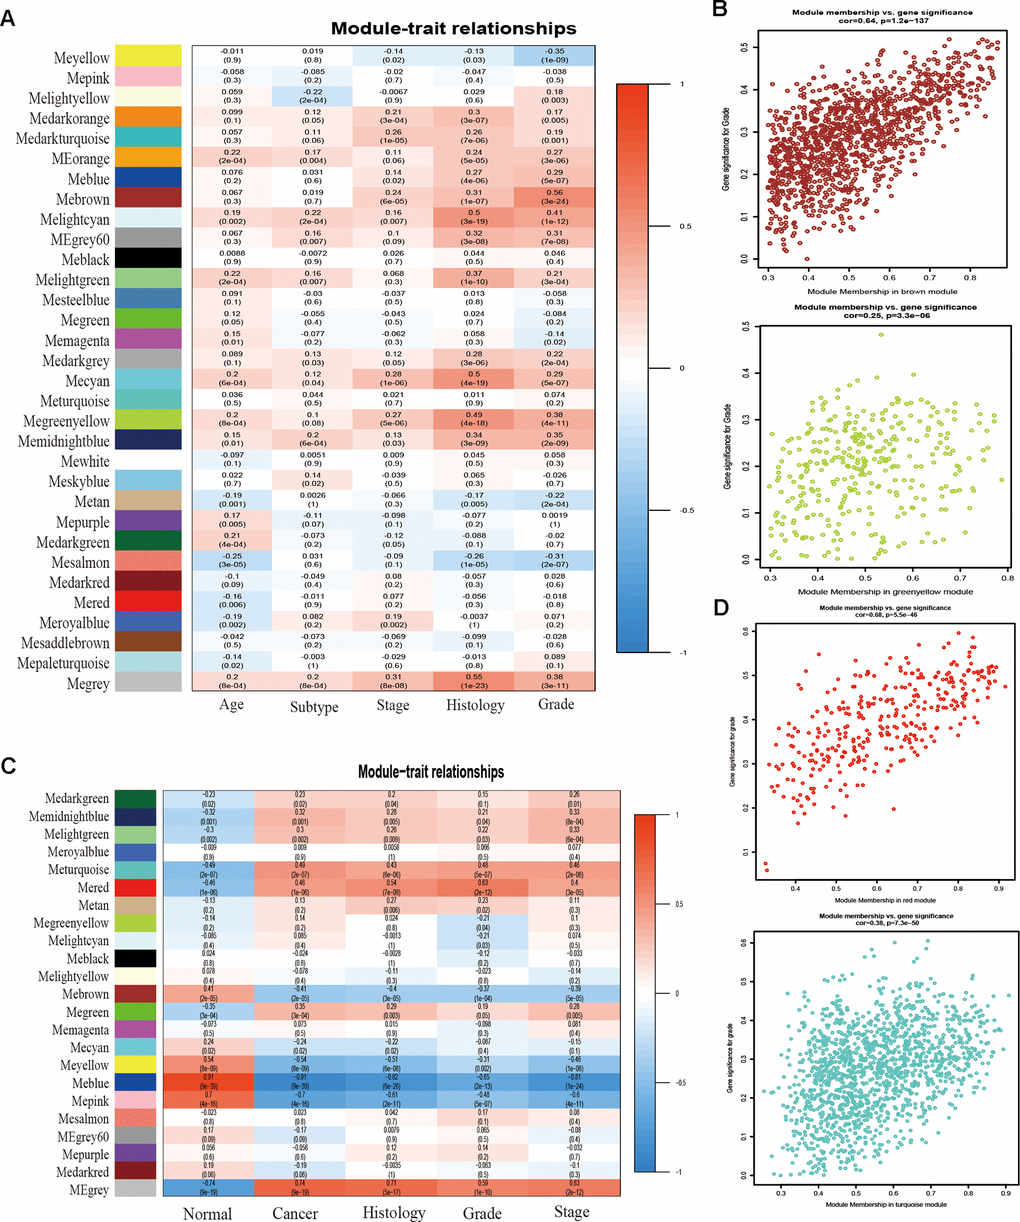
Figure 2.Correlation between module eigengenes and clinical traits. (A) Correlation between modules and traits of TCGA data. (B) Scatter plots of GS versus the MM in the brown and green-yellow modules of TCGA data. (C) Correlation between modules and traits of GSE17025 data. (D) Scatter plots of module eigengenes in turquoise and red modules of GSE17025.