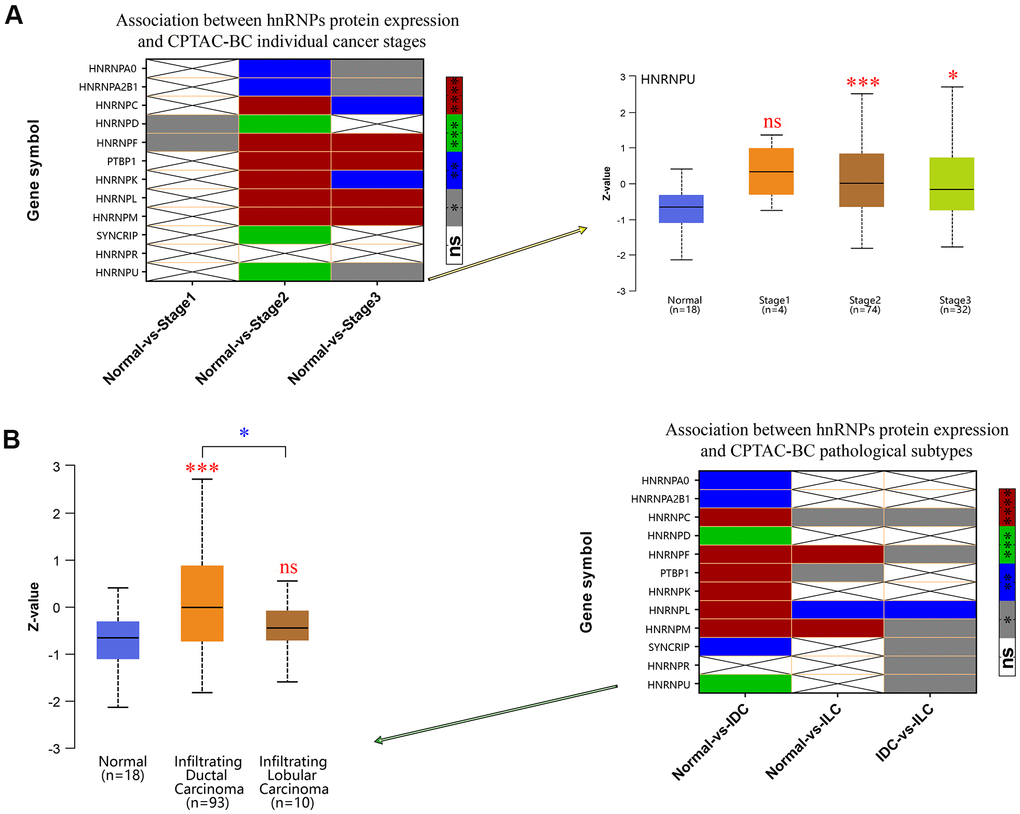
Figure 4.Correlation between hnRNP protein expression, tumor stage, and pathological subtypes. (A) Heat map displaying the correlation between hnRNP protein expression and tumor stage. The boxplot shows the association between HNRNPU protein expression and tumor stage. (B) Heat map displaying the correlation between hnRNP protein expression and tumor pathological subtypes. The boxplot shows the association between HNRNPU protein expression and tumor pathological subtypes. Gray represents *P < 0.05, blue represents **P < 0.01, green represents ***P < 0.001, red represents ****P < 0.0001, and white represents no significant difference.