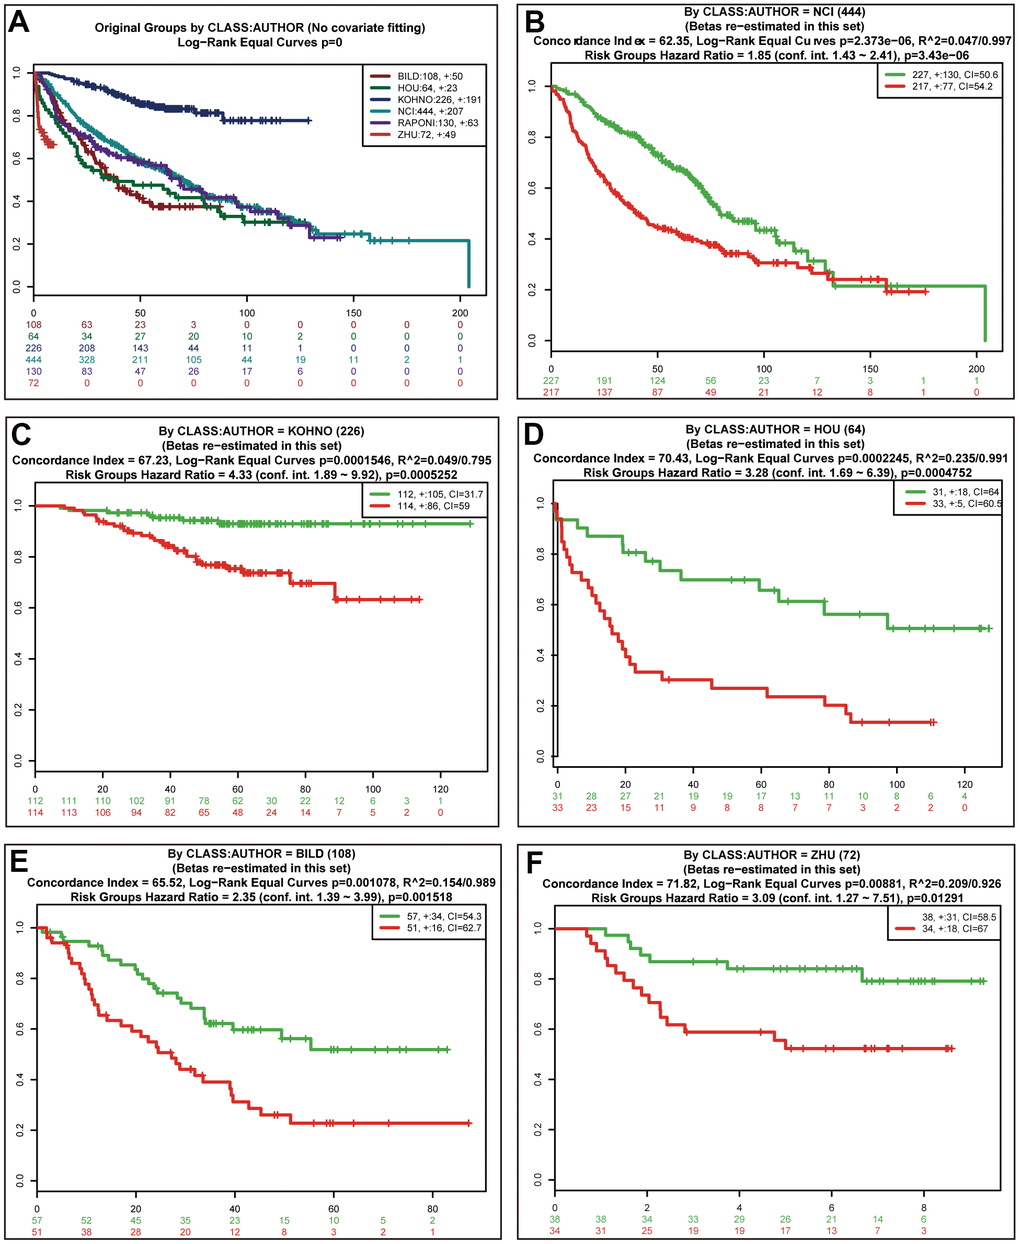
Figure 8.Validation of the prognostic power of risk scores in the independent lung cancer cohorts. Kaplan-Meier survival curves of 6 independent lung cancer cohorts (A). Performance of risk scores in the NCI (B), KOHNO (C), HOU (D), BILD (E), and ZHU (F) cohorts.