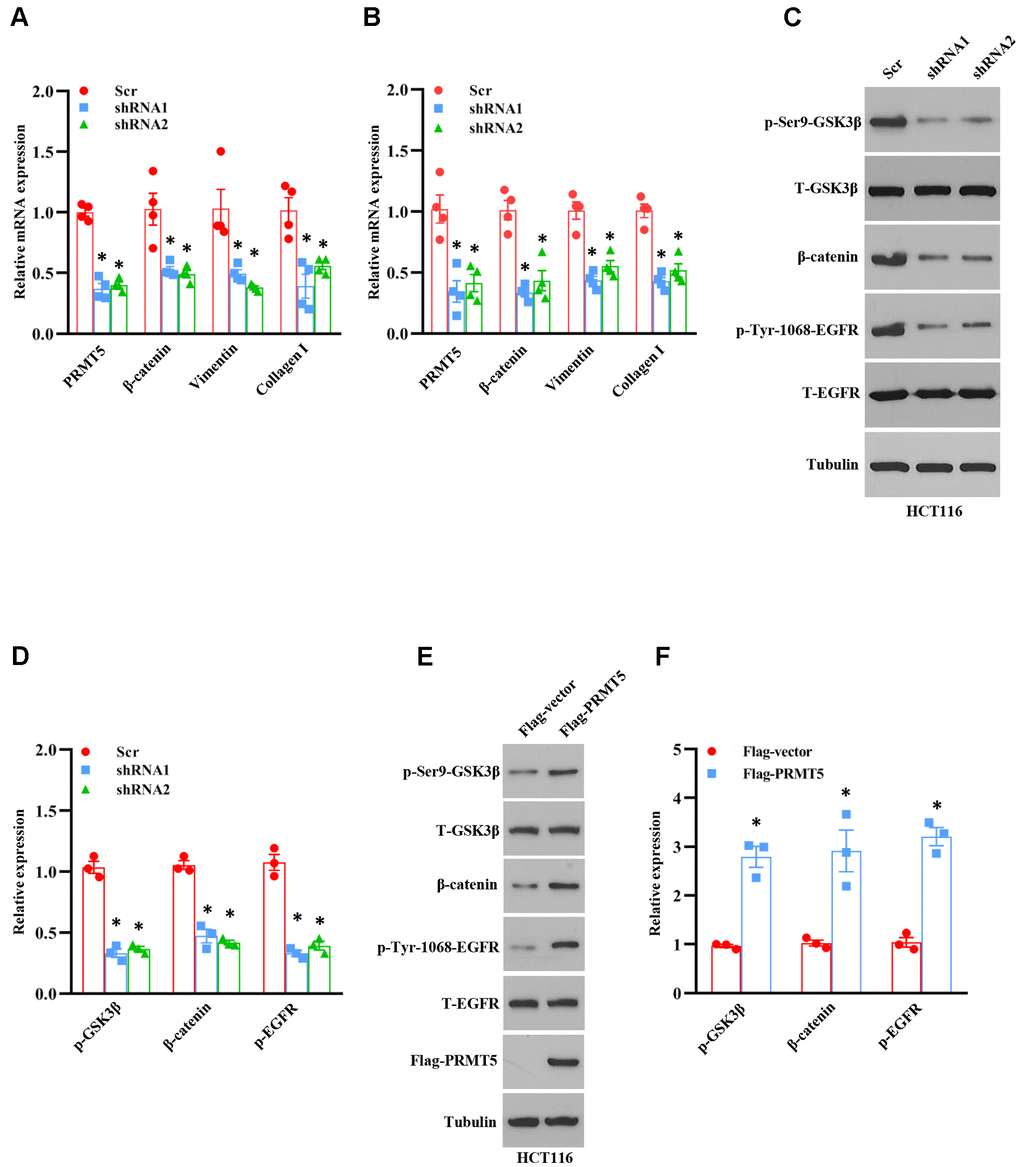
Figure 5.PRMT5 control EMT through Akt/GSK3β signaling axis. (A, B) qRT-PCR analysis of EMT markers in HCT116 and SW480 cells. *P < 0.05 vs. Scr. (C) Western blot analysis of indicated protein expression level in HCT116 cells. Representative data is shown. (D) The indicated proteins are quantified in HCT116 cells. *P < 0.05 vs. Scr. (E) Western blot analysis of indicated protein expression level in HCT116 cells. Representative data is shown. (F) The indicated proteins are quantified in HCT116 cells. *P < 0.05 vs. DMSO.