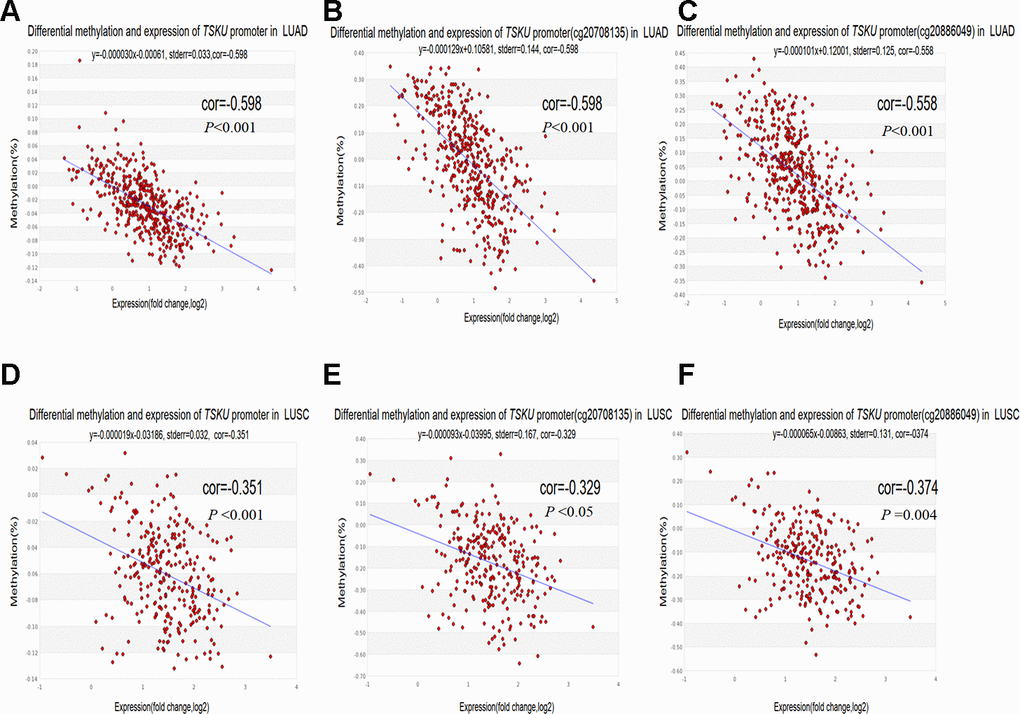
Figure 5.Correlations between differential TSKU methylation and expression in LUAD and LUSC. TCGA Infinium 450K methylation probes in the promoter region, including the cg20708175 and cg20886049 probes; (A–C) Scatterplots of correlations between differential TSKU methylation and expression level of all CpG sites (probes) in the promoter (A), cg20708175 (B), and cg20886049 (C) in LUAD (N = 471). (D–F) Scatterplots of correlations between differential TSKU methylation and expression level of all CpG sites (probes) in the promoter (D), cg20708175 (E), and cg20886049 (F) in LUSC (N = 406). Cor(r): the value determined by calculating the Pearson correlation coefficient.