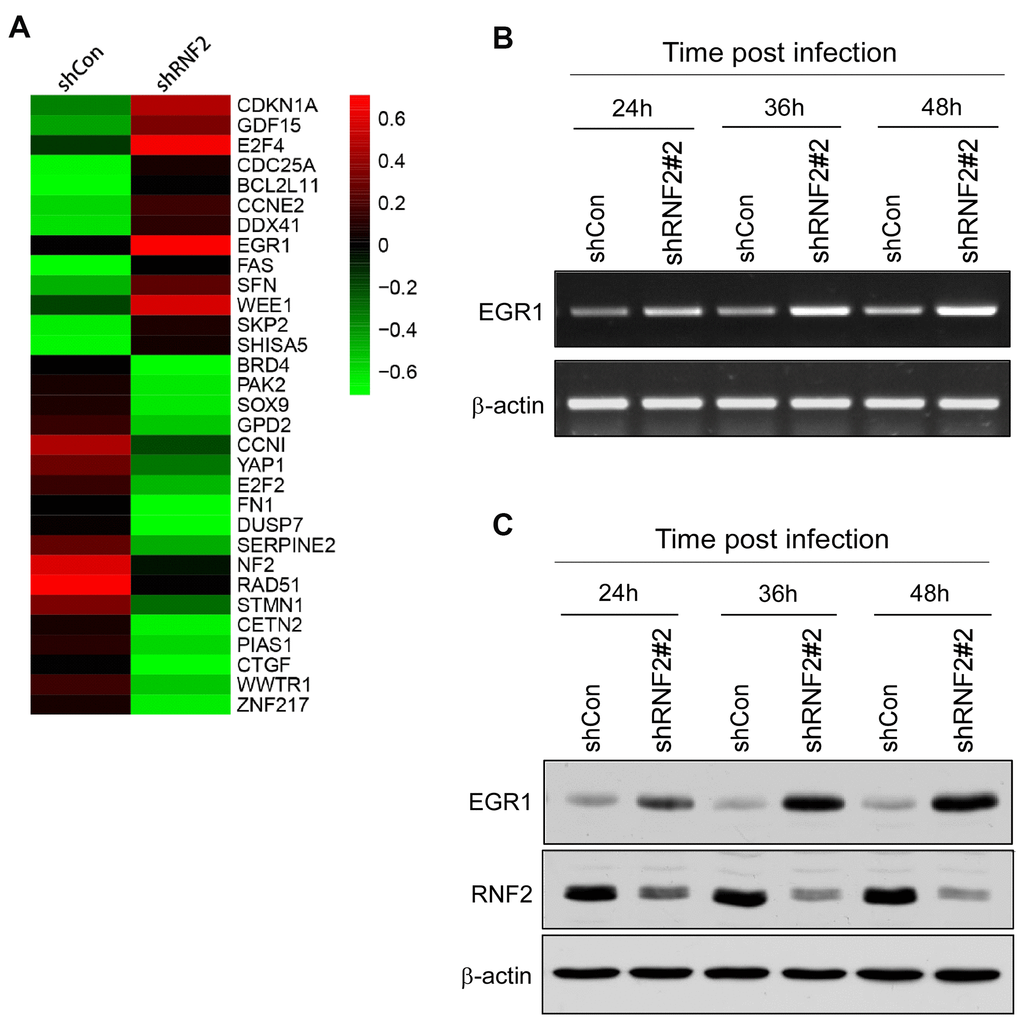
Figure 3.The downregulation of RNF2 induced EGR1 expression. (A) Heat map of some of the most differentially expressed genes in shRNF2-treated HCT116 cells, determined through microarray analyses (red: upregulated; green: downregulated). (B) RT-PCR analysis showing the increased EGR1 mRNA levels in RNF2-knockdown HCT116 cells. (C) Western blot showing the increased EGR1 protein levels in RNF2-knockdown HCT116 cells.