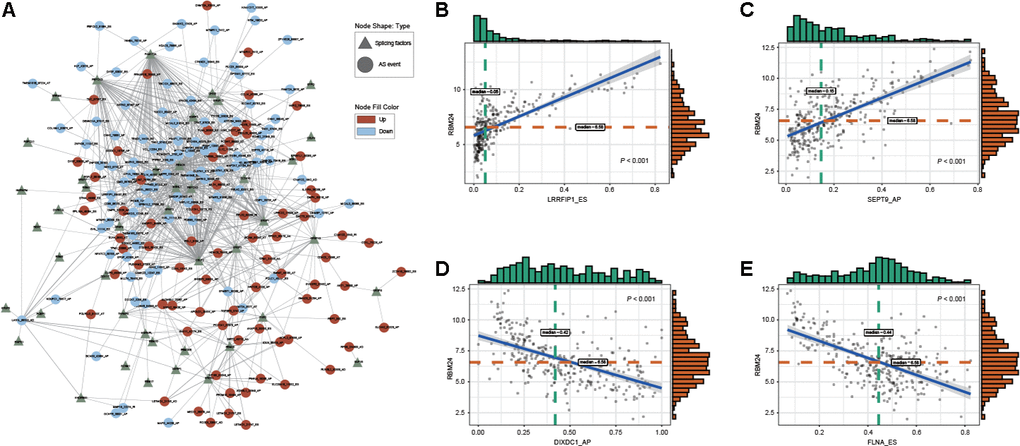
Figure 5.Regulatory splicing correlation network in GC. (A) The correlation of DEAS events with SFs is shown in network plots. (B, C) Representative positive correlations between DEAS events and SFs are shown in scatter plots. (D, E) Representative negative correlations between DEAS events and SFs are shown in scatter plots.