Submit an Article
Navigate
Home
Editorial Board
Editorial Policies
Current Volume
Archive
Scientific Integrity
Publication Ethics Statements
Interviews with Outstanding Authors
Newsroom
Sponsored Conferences
Podcast
Contact
Special Collections
Submit an Article
Online ISSN: 1945-4589
Research Paper
|
Volume 13, Issue 3
|
pp. 4317–4334
The landscape of alternative splicing reveals novel events associated with tumorigenesis and the immune microenvironment in gastric cancer
Back to article
Figure 3
(3 of 8)
−
100%
+
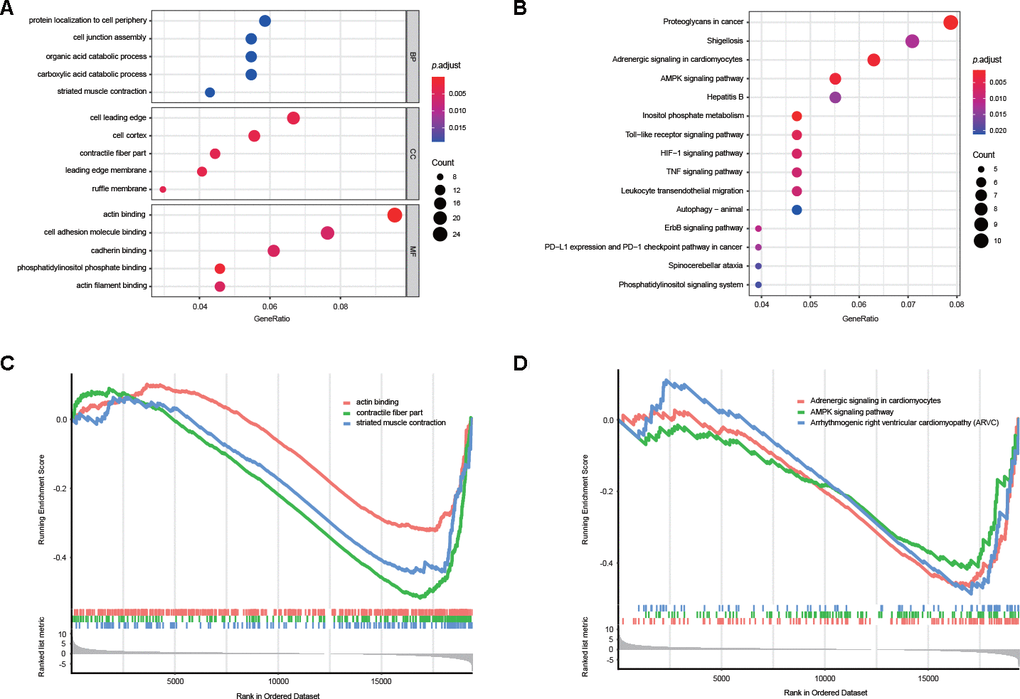
Figure 3.
Potential biological functions of DEAS events.
(
A
) GO analysis of DEAS events is shown in bubble plots. (
B
) KEGG analysis of DEAS events is shown in bubble plots. (
C
,
D
) GSEA of DEAS events.