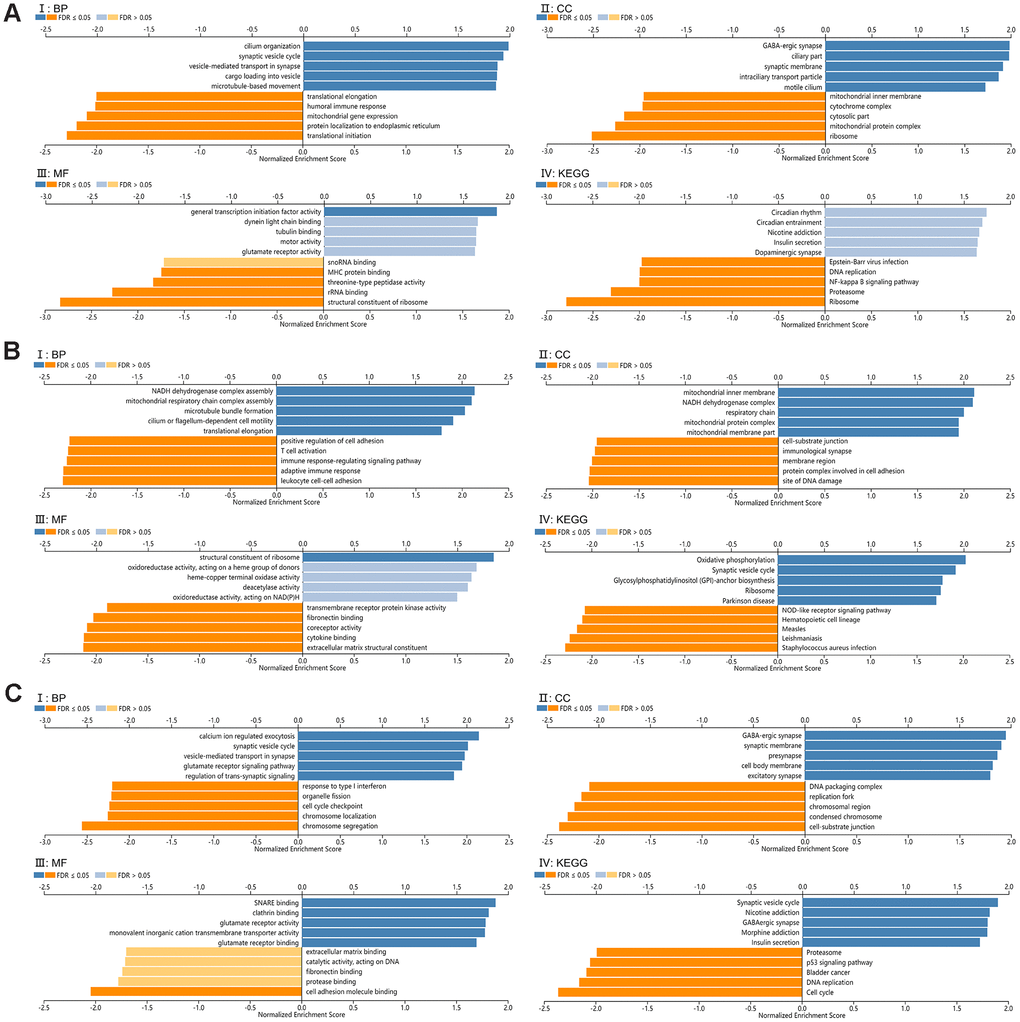
Figure 6.Functional enrichment analysis for SCAMP1, 4, 5. (A–C) Gene set enrichment analysis (GSEA) GO and KEGG pathway analysis for SCAMP1(A), 4(B), 5(C) respectively, (CC): Cellular components. (BP): Biological processes. (MF): Molecular functions. (KEGG): KEGG pathway analysis. (I: BP, II: CC, III: MF, IV: KEGG).