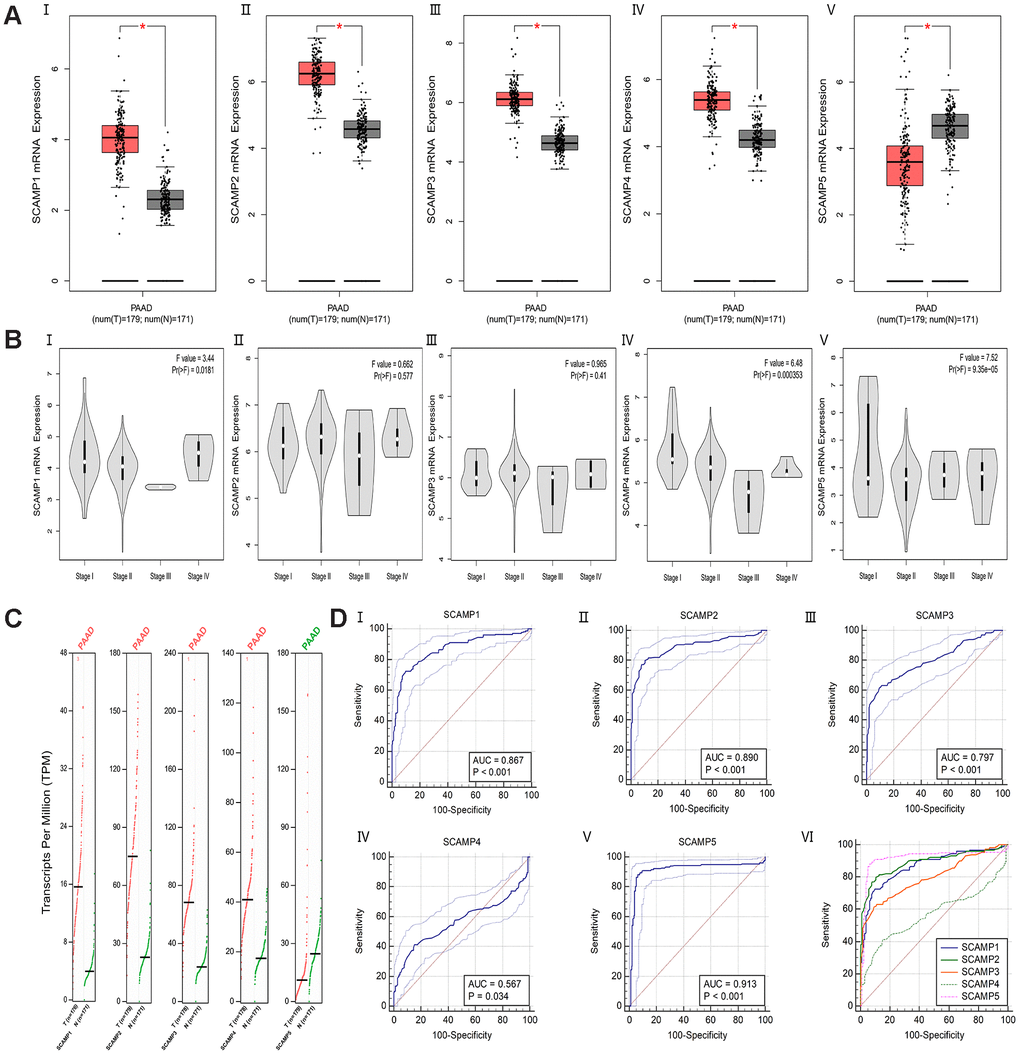
Figure 1.Differential expression and ROC curves of SCAMPs in PAAD. (A) Differential expression of SCAMP 1-5 (I-V) in PAAD (log2(TPM + 1)). (B) Expression violin plots of SCAMP 1-5 (I-V) based on patient pathological stage (log2(TPM + 1)). (C) Differential expression of SCAMP 1-5 in PAAD (TPM). (D) The Area Under the Curve (AUC) metrics are also provided for SCAMP1-5 (I-V) to predict diagnosis in PAAD by Medcalc (version 19.0); the comparison of ROC curves for SCAMP1-5 (VI).