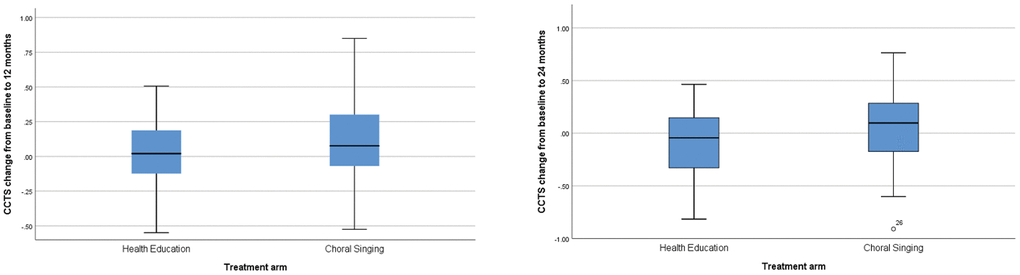
Figure 2.Box plots of raw data for CCTS change from baseline to 12 and 24 Months. Data are median (central line), interquartile range (box margins), adjacent values (whiskers), and outlier (dots).
Figure 2 — Effects of choral singing versus health education on cognitive decline and aging: a randomized controlled trial | Aging