Submit an Article
Navigate
Home
Editorial Board
Editorial Policies
Current Volume
Archive
Scientific Integrity
Publication Ethics Statements
Interviews with Outstanding Authors
Newsroom
Sponsored Conferences
Podcast
Contact
Special Collections
Submit an Article
Online ISSN: 1945-4589
Research Paper
|
Volume 13, Issue 3
|
pp. 4024–4044
Identification of candidate genes encoding tumor-specific neoantigens in early- and late-stage colon adenocarcinoma
Back to article
Figure 6
(6 of 12)
−
100%
+
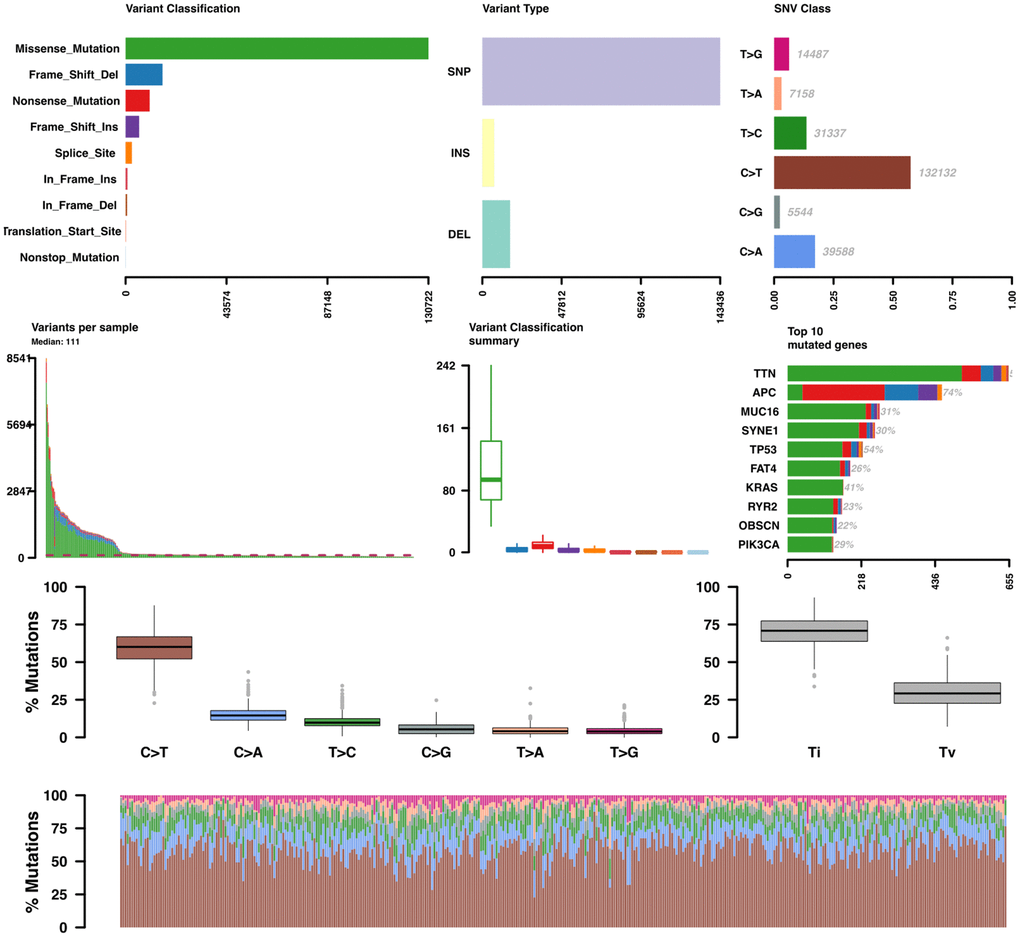
Figure 6.
Somatic variant analysis of COAD-TCGA data.
Variants per sample are shown as a stacked barplot and variant types as a boxplot summarized by variant classification.