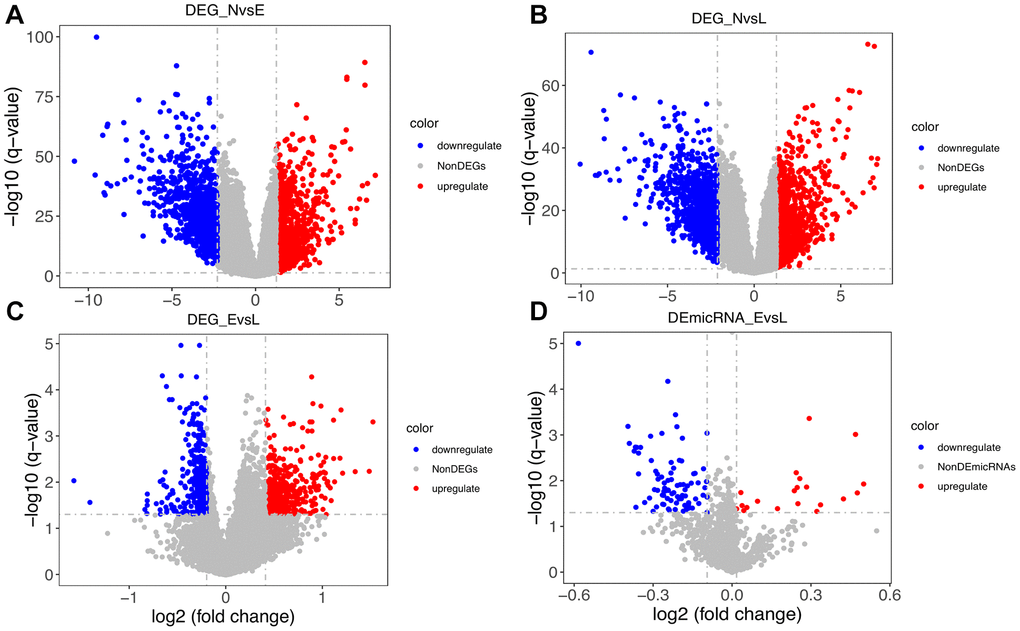
Figure 2.Distribution of differentially expressed genes. (A) Distribution of DEGs between normal (N) and early-stage (E) samples. (B) Distribution of DEGs between N and late-stage (L) samples. (C) Distribution of DEGs between E and L samples. (D) Distribution of differentially expressed microRNAs between E and L samples.