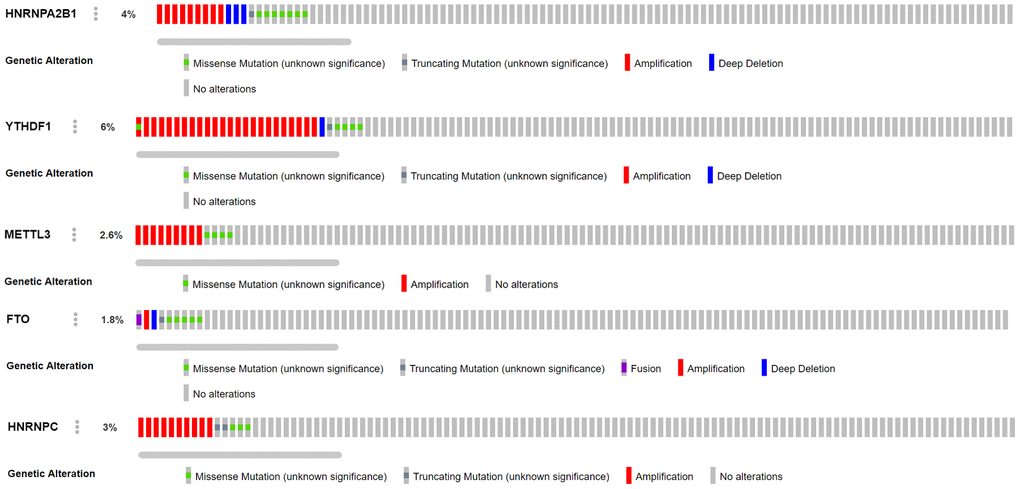
Figure 6.Analysis of CNV mutations in 5 M6A-related genes in lung adenocarcinoma data of cBioportal platform. Red represents an amplification in the number of copies, blue represents a deletion in the number of copies, green represents missense mutation, and gray represents truncating mutation.