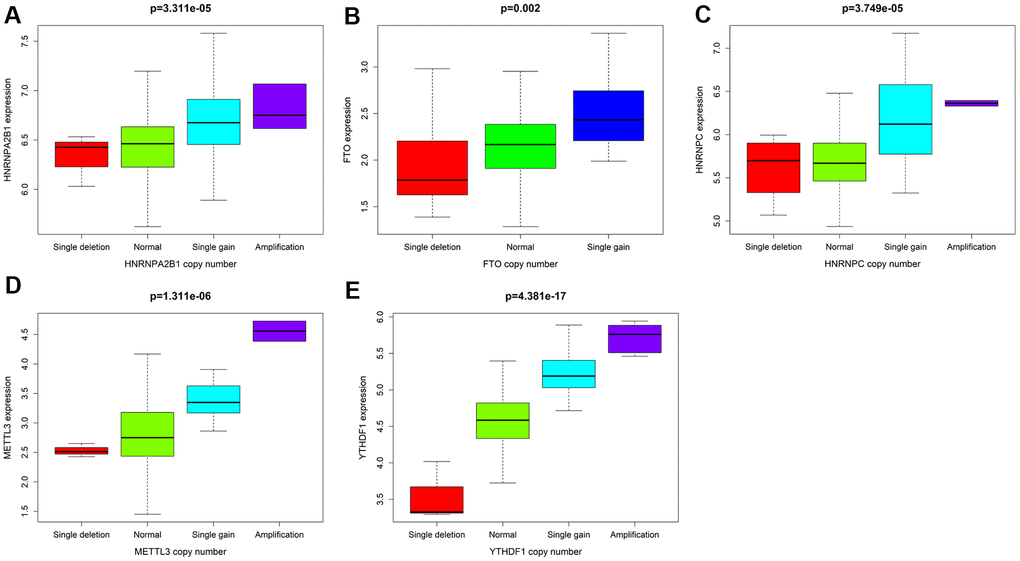
Figure 5.With P<0.05 as the cutoff value, the correlation analysis between CNV mutations and the expression of 5 M6A-related genes. (A) HNRNPA2B1 (B) FTO (C) HNRNPC (D) METTL3 (E) YTHDF1.
Figure 5 — Gene signatures of 6-methyladenine regulators in women with lung adenocarcinoma and development of a risk scoring system: a retrospective study using the cancer genome atlas database | Aging