Submit an Article
Navigate
Home
Editorial Board
Editorial Policies
Current Volume
Archive
Scientific Integrity
Publication Ethics Statements
Interviews with Outstanding Authors
Newsroom
Sponsored Conferences
Podcast
Contact
Special Collections
Submit an Article
Online ISSN: 1945-4589
Research Paper
|
Volume 13, Issue 3
|
pp. 3957–3968
Gene signatures of 6-methyladenine regulators in women with lung adenocarcinoma and development of a risk scoring system: a retrospective study using the cancer genome atlas database
Back to article
Figure 4
(4 of 6)
−
100%
+
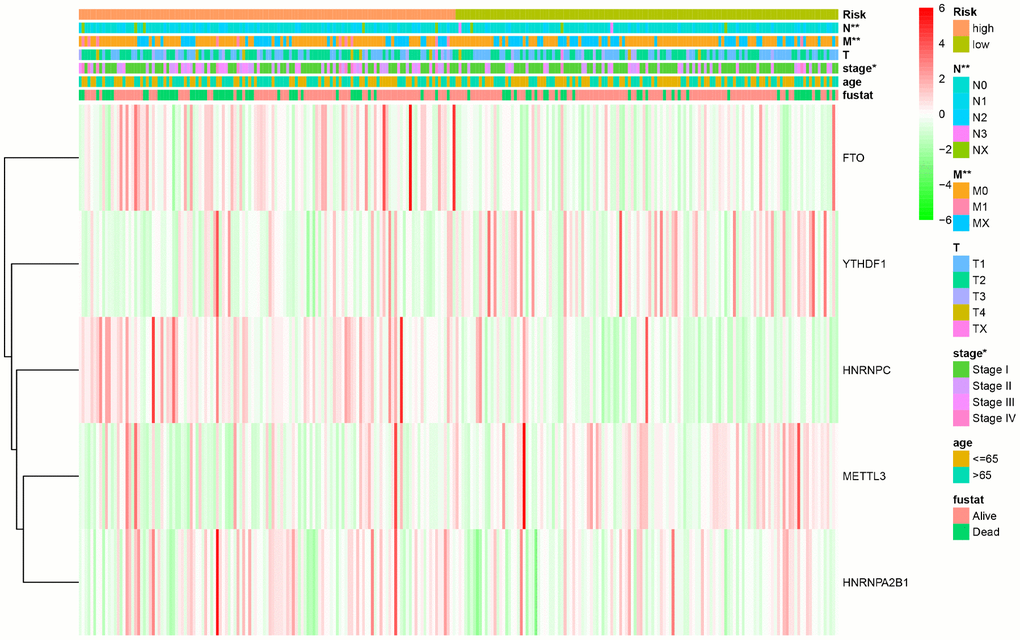
Figure 4.
The relationship between the risk score and different clinical traits (* represents p < 0.05, ** represents p < 0.01, and *** represents p < 0.001).