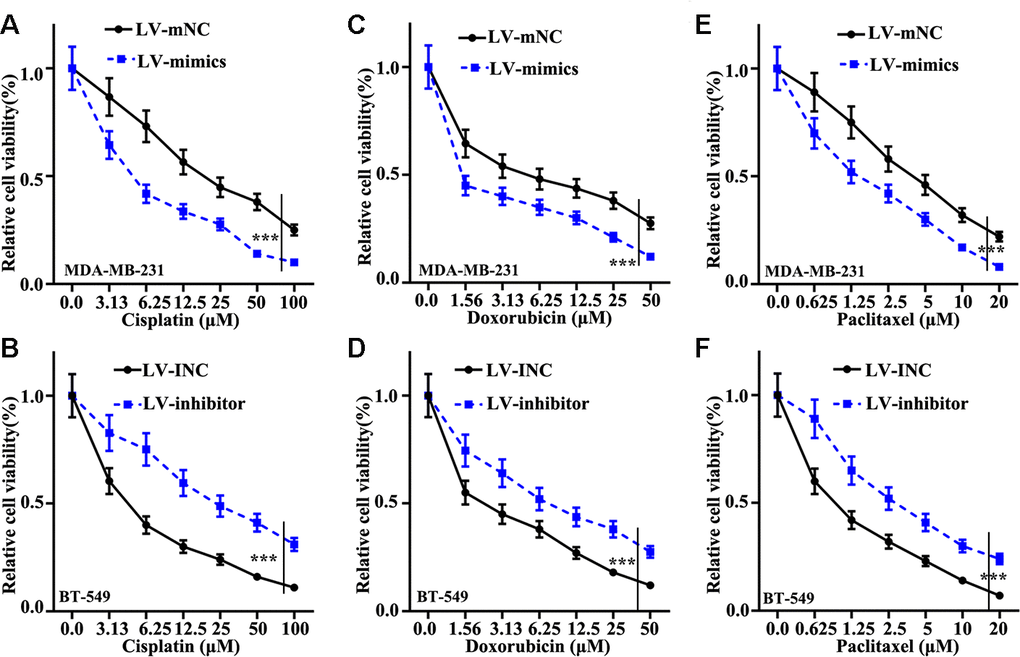
Figure 3.Effect of miR-205 on chemotherapy sensitivity of TNBC cells. (A) Cell proliferation analysis of Cisplatin in miR-205 overexpression treatment in MDA-MB-231 cells. (B) Cell proliferation analysis of Cisplatin in miR-205 knockdown treatment in BT-549 cells. (C) Cell proliferation analysis of Doxorubicin in miR-205 overexpression treatment in MDA-MB-231 cells. (D) Cell proliferation analysis of Doxorubicin in miR-205 knockdown treatment in BT-549 cells. (E) Cell proliferation analysis of Paclitaxel in miR-205 overexpression treatment in MDA-MB-231 cells. (F) Cell proliferation analysis of Paclitaxel in miR-205 knockdown treatment in BT-549 cells. ***P<0.001.