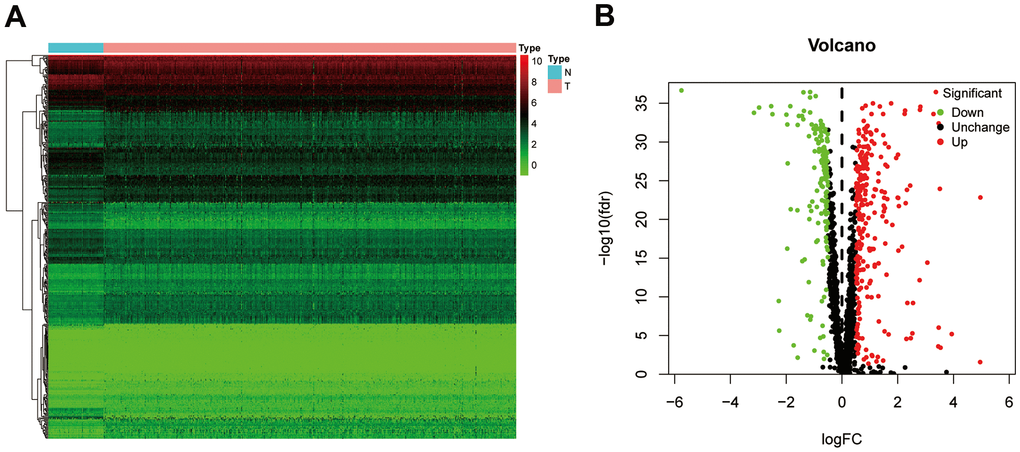
Figure 2.The differentially expressed RBPs in ccRCC. (A) Heatmap of differentially RBPs in different samples. Red represents upregulation and green represents downregulation. (B) Volcanic plot showing dysregulated RBPs in ccRCC tissue samples. ccRCC, clear cell renal cell carcinoma; RBPs, RNA-binding proteins.