Submit an Article
Navigate
Home
Editorial Board
Editorial Policies
Current Volume
Archive
Scientific Integrity
Publication Ethics Statements
Interviews with Outstanding Authors
Newsroom
Sponsored Conferences
Podcast
Contact
Special Collections
Submit an Article
Online ISSN: 1945-4589
Research Paper
|
Volume 13, Issue 1
|
pp. 1410–1421
Prognostic and clinical significance of modified glasgow prognostic score in pancreatic cancer: a meta-analysis of 4,629 patients
Back to article
Figure 5
(5 of 5)
−
100%
+
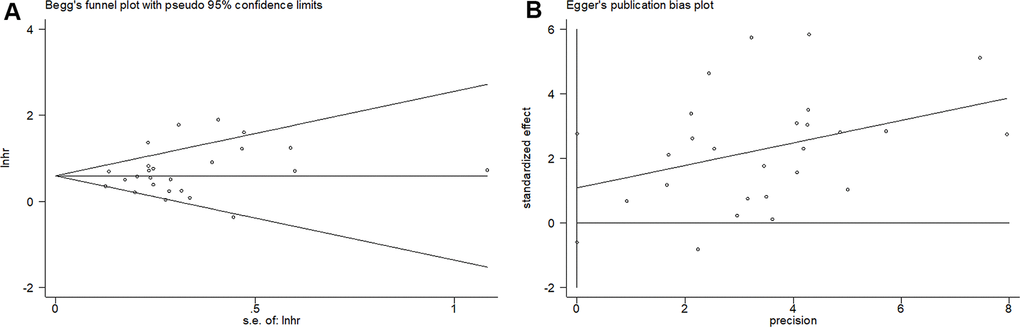
Figure 5.
Begg’s funnel plots and Egger’s publication bias plots for studies involved in the meta-analysis.
(
A
) Begg’s test of overall survival (p=0.388) and (
B
) Egger’s test of overall survival (p= 0.197).