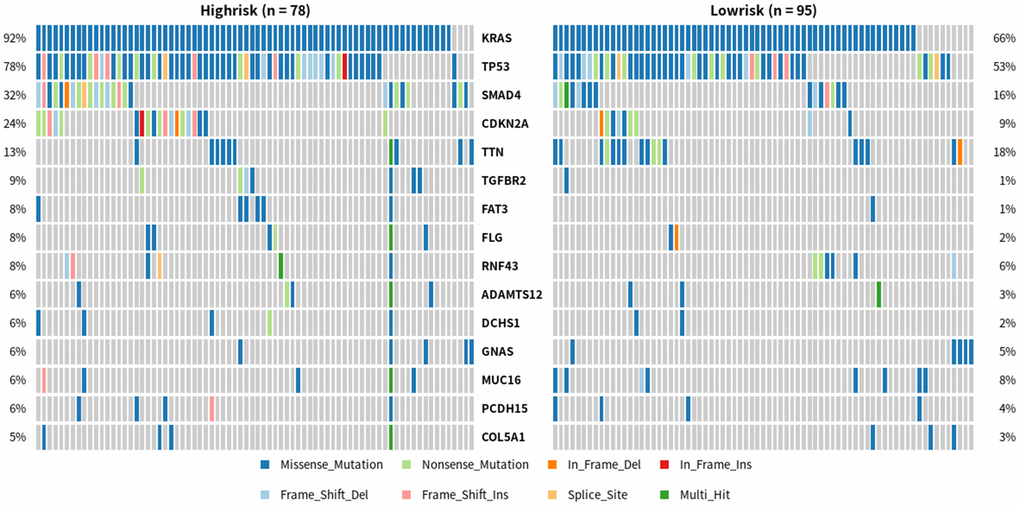
Figure 7.Differences in gene mutations between high-risk and low-risk PDAC patients. One row represents a gene, and the top 15 is intercepted from it; One column is a sample, high risk group (n=78), low risk group (n=95). Different colors represent different types of mutations.