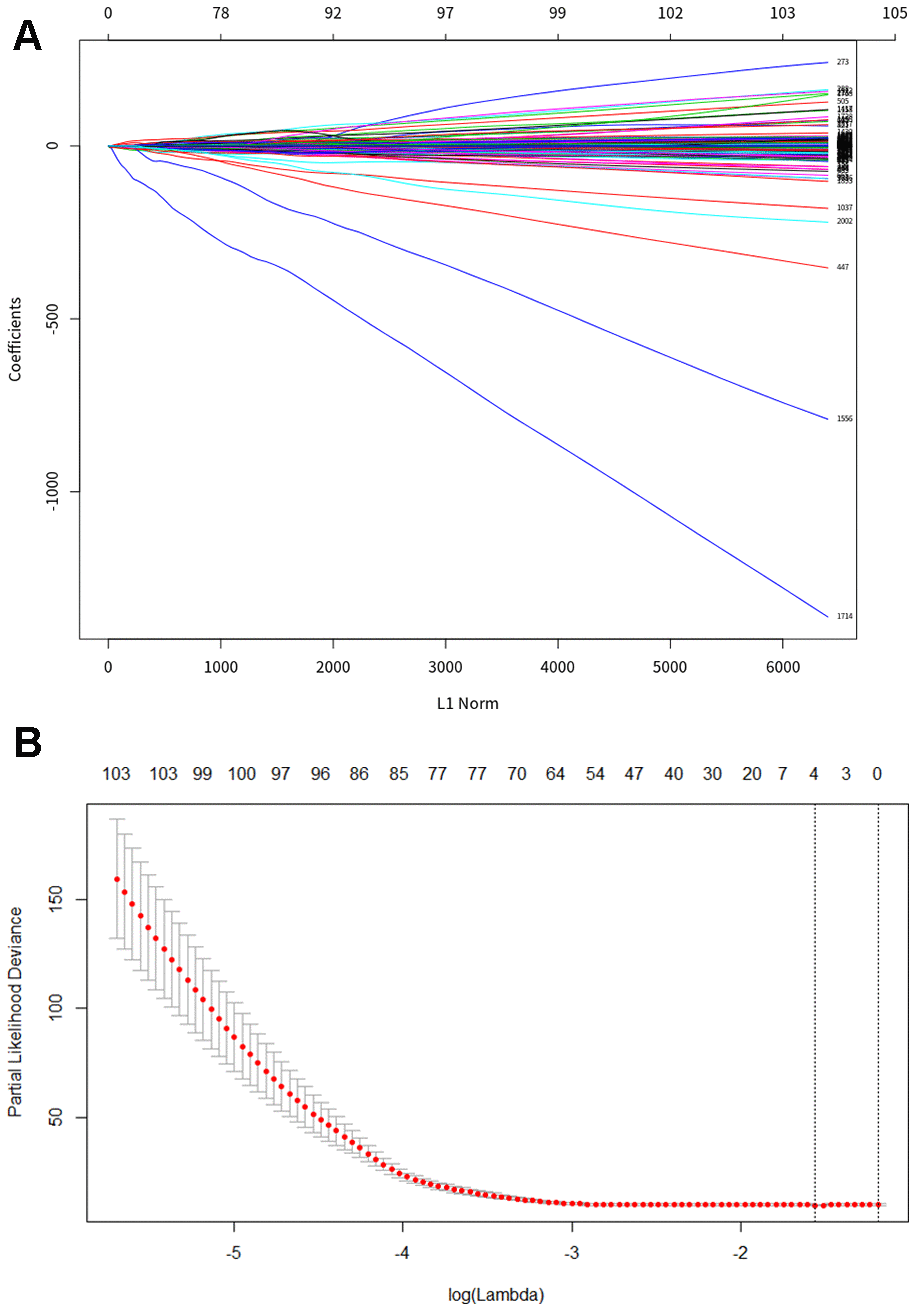
Figure 1.LASSO regression analysis to construct PDAC specific diagnosis model. (A) Least absolute shrinkage and selection operator (LASSO) coefficient profiles of differential methylation site. (B) Cross-validation for tuning parameter selection in the LASSO model, the two dotted vertical lines are drawn at the optimal values by lambda. min 0.06973033 and lambda.1se 0.2032676.