Submit an Article
Navigate
Home
Editorial Board
Editorial Policies
Current Volume
Archive
Scientific Integrity
Publication Ethics Statements
Interviews with Outstanding Authors
Newsroom
Sponsored Conferences
Podcast
Contact
Special Collections
Submit an Article
Online ISSN: 1945-4589
Research Paper
|
Volume 13, Issue 3
|
pp. 3798–3818
Deciphering the correlations between aging and constipation by metabolomics and network pharmacology
Back to article
Figure 3
(3 of 7)
−
100%
+
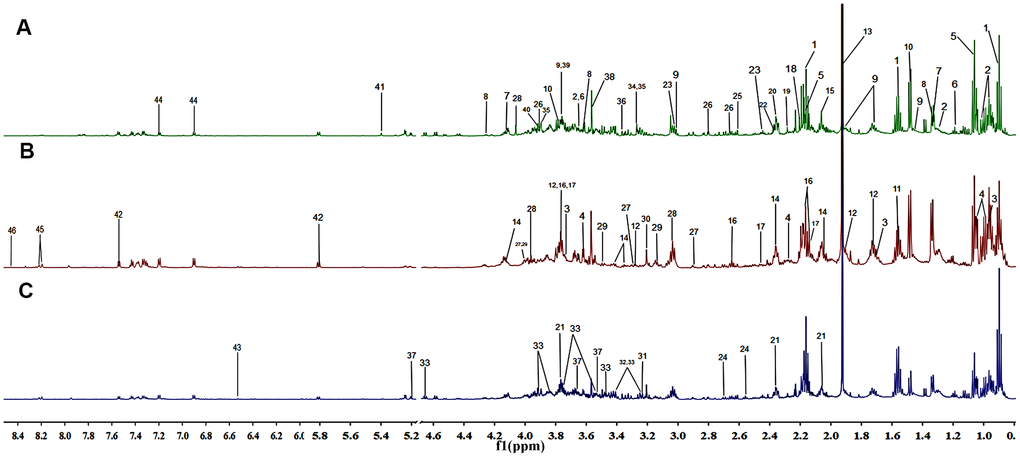
Figure 3.
Representation of the 600 MHz
1
H NMR spectra of the fecal samples collected from the negative control group (
A
), the aging group (
B
) and the constipation group (
C
). The assignments of 46 metabolites are given in
Table 3
.