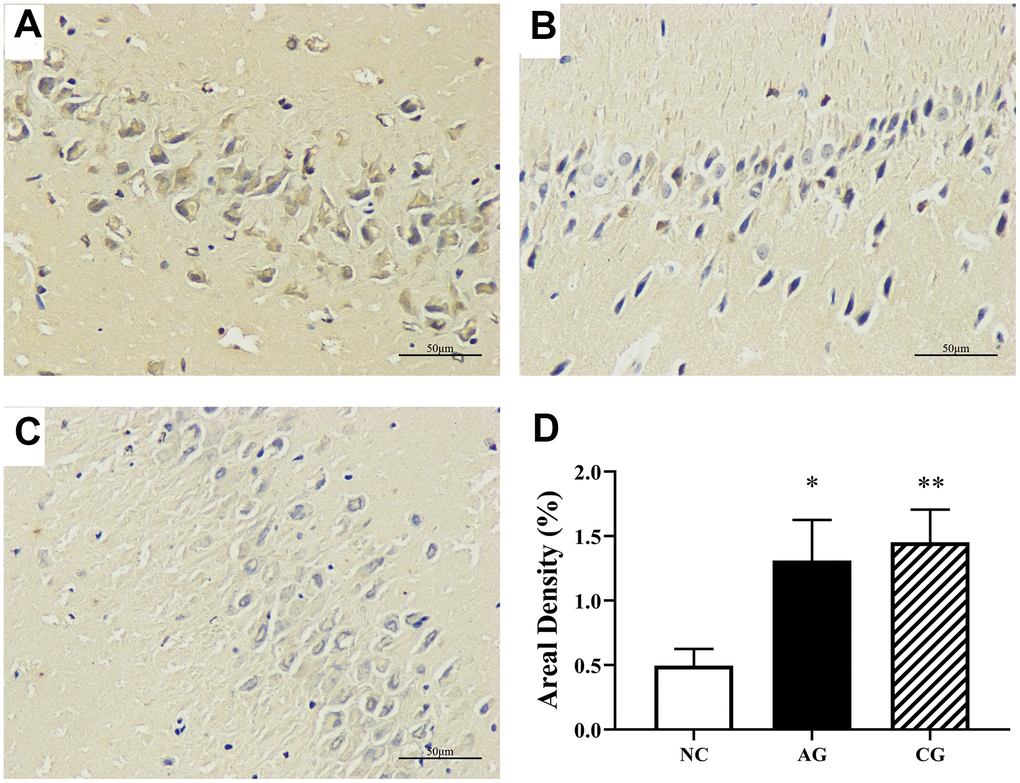
Figure 2.Hippocampal immunohistochemical analysis of the negative control group (A), the aging group (B) and the constipation group (C) under an optical microscopy (400 × magnification) and their semi-quantification (D). Data were presented as the mean ± S.E. (n=3).