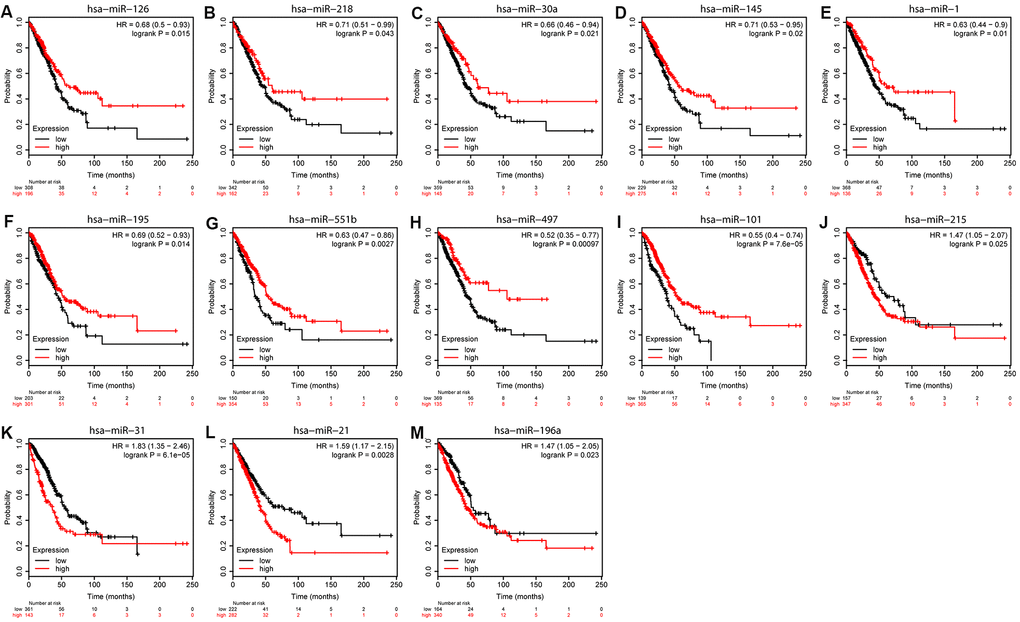
Figure 5.Overall survival analyses of DEMs. KM curves depicting OS for LUAD patients with high and low expression of (A) hsa-miR-126, (B) hsa-miR-218, (C) hsa-miR-30a, (D) hsa-miR-145, (E) hsa-miR-1, (F) hsa-miR-195, (G) hsa-miR-551b, (H) hsa-miR-497, (I) hsa-miR-101, (J) hsa-miR-215, (K) hsa-miR-31, (L) hsa-miR-21, and (M) hsa-miR-198a.