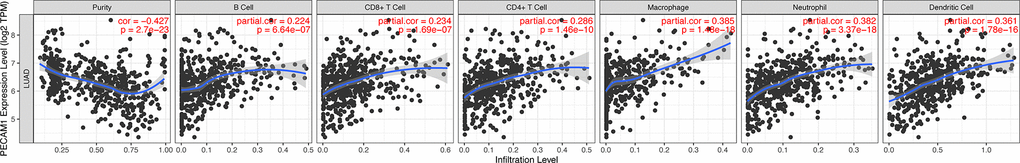
Figure 13.Correlation of PECAM1 expression with immune cell infiltration levels in LUAD. Tumor-infiltrating immune cells included B cells, CD4+ T cells, CD8+ T cells, neutrophils, macrophages, and DCs. Gene expression levels against tumor purity are displayed in the left-most panel.