Submit an Article
Navigate
Home
Editorial Board
Editorial Policies
Current Volume
Archive
Scientific Integrity
Publication Ethics Statements
Interviews with Outstanding Authors
Newsroom
Sponsored Conferences
Podcast
Contact
Special Collections
Submit an Article
Online ISSN: 1945-4589
Research Paper
|
Volume 13, Issue 3
|
pp. 3742–3762
Key microRNAs and hub genes associated with poor prognosis in lung adenocarcinoma
Back to article
Figure 10
(10 of 14)
−
100%
+
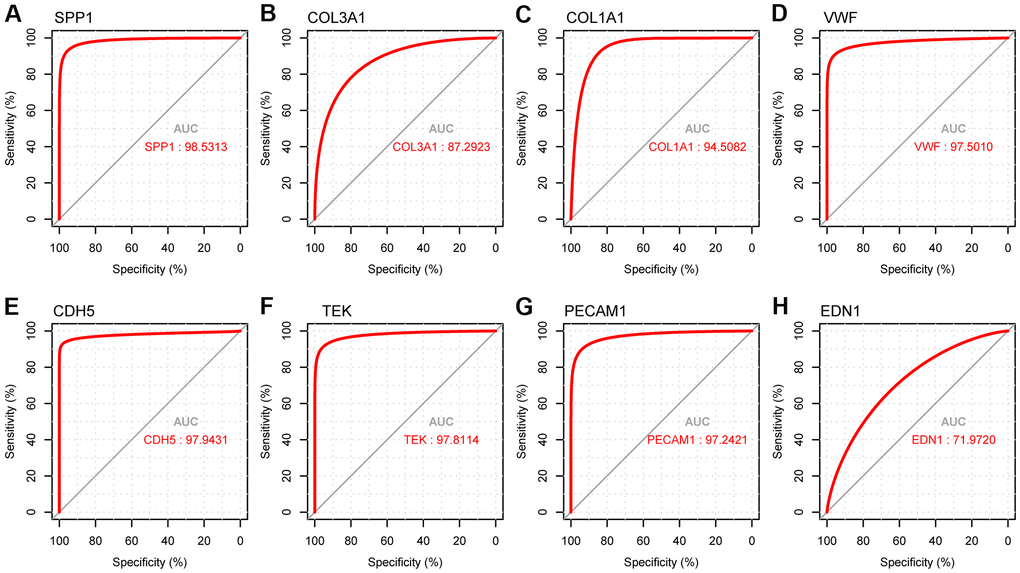
Figure 10.
ROC curve analysis presenting the sensitivity and specificity of hub genes in LUAD diagnosis.
(
A
) ROC curves of SPP1, (
B
) COL3A1, (
C
) COL1A1, (
D
) VWF, (
E
) CDH5, (
F
) TEK, (
G
) PECAM1, and (
H
) END1.
Figure 10 — Key microRNAs and hub genes associated with poor prognosis in lung adenocarcinoma | Aging