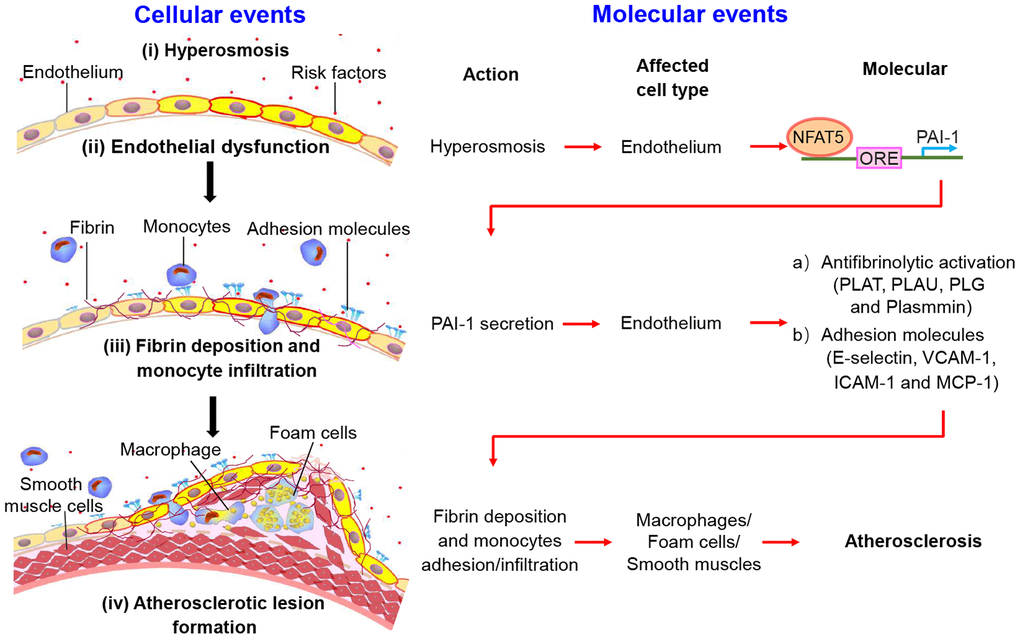
Figure 8.The schematic diagram shows the process of fibrin deposition, macrophage infiltration and atherosclerosis formation. Stage I: Hypertonicity → NFAT5-dependent PAI-1 gene transcription → PAI-1 secretion. Stage II: PAI-1 secretion → Antifibrinolytic activation/adhesive molecules → Fibrin deposition/monocytes adhesion and infiltration. Stage III: Endothelial dysfunction leads to fibrin deposition, macrophage-driven foam cells and phenotype conversion of smooth muscle cells, contributing to the formation of atherosclerotic plaque.