Submit an Article
Navigate
Home
Editorial Board
Editorial Policies
Current Volume
Archive
Scientific Integrity
Publication Ethics Statements
Interviews with Outstanding Authors
Newsroom
Sponsored Conferences
Podcast
Contact
Special Collections
Submit an Article
Online ISSN: 1945-4589
Research Paper
|
Volume 13, Issue 3
|
pp. 3618–3644
Identification of novel SNPs associated with coronary artery disease and birth weight using a pleiotropic cFDR method
Back to article
Figure 2
(2 of 3)
−
100%
+
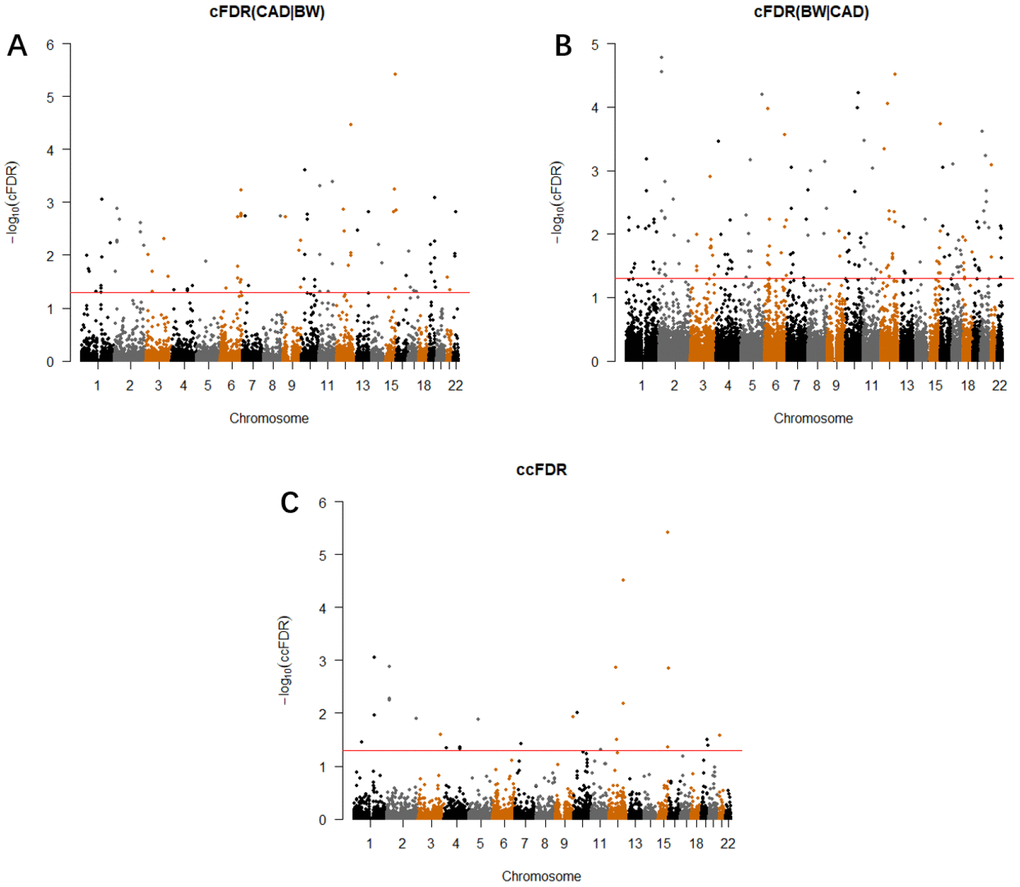
Figure 2.
Conditional Manhattan plot.
SNPs with -log10(cFDR) ≥ 1.3 (cFDR ≤ 0.05) for (
A
) CAD given BW (CAD|BW) and (
B
) BW given CAD (BW|CAD), or (
C
) -log10(ccFDR) ≥ 1.3 (ccFDR ≤ 0.05) are shown above the red line.