Submit an Article
Navigate
Home
Editorial Board
Editorial Policies
Current Volume
Archive
Scientific Integrity
Publication Ethics Statements
Interviews with Outstanding Authors
Newsroom
Sponsored Conferences
Podcast
Contact
Special Collections
Submit an Article
Online ISSN: 1945-4589
Research Paper
|
Volume 13, Issue 1
|
pp. 1294–1313
Exercise reduces metabolic burden while altering the immune system in aged mice
Back to article
Figure 6
(6 of 6)
−
100%
+
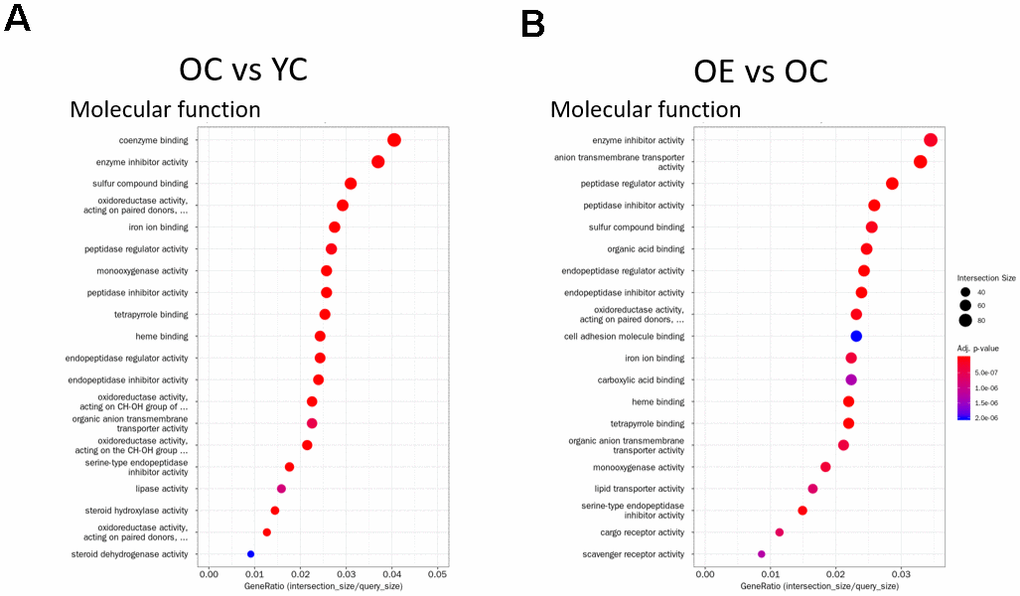
Figure 6.
Gene Ontology Enrichment analysis.
(
A
,
B
) Enrichment results for the top 20 GO terms in (
A
) OC vs YC and (
B
) OE vs OC that satisfy adjusted
p
-value < 0.05 for each GO category are plotted. Dot size indicates Gene Ratio.