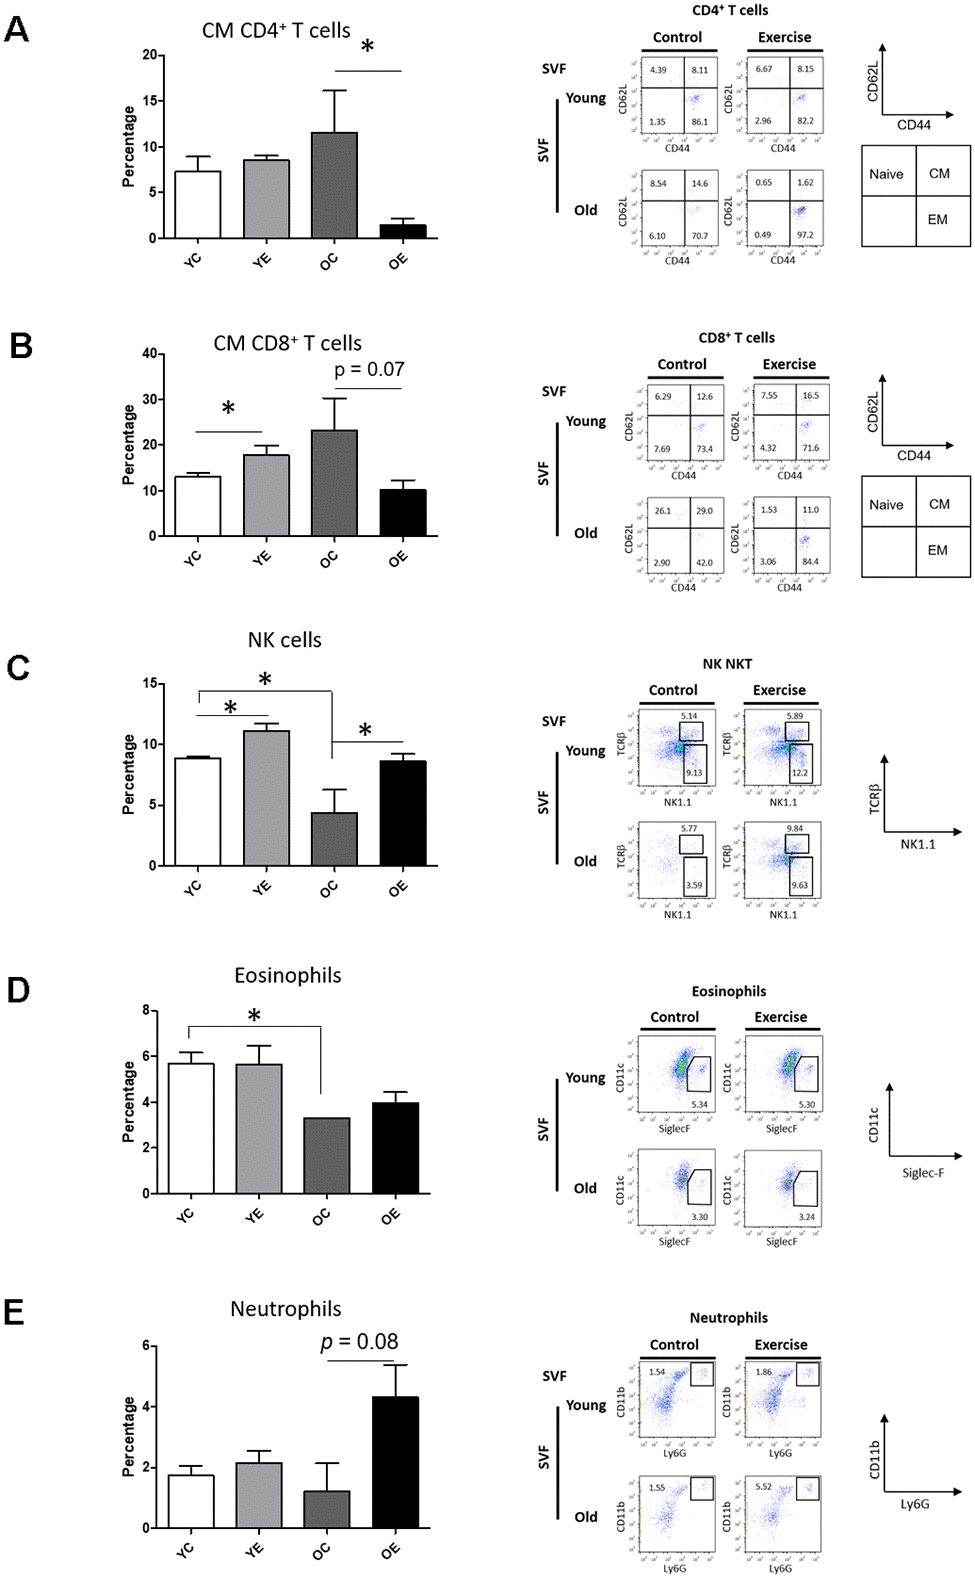
Figure 3.Effect of exercise on Immune cell profiling in SVF and spleen of young and aged mice. Bar graph and dot plots depict the frequencies of central memory (CM, CD62L+CD44+) CD4+ T cells (A); the frequencies of CM CD8+ T cells (B); the frequencies of NK (NK1.1+TCRβ-) cells (C); the frequencies of eosinophils (F4/80+Siglec-F+) (D); and the frequencies of neutrophils (F4/80-CD11c-CD11b+Ly6G+) (E) in SVF.