Submit an Article
Navigate
Home
Editorial Board
Editorial Policies
Current Volume
Archive
Scientific Integrity
Publication Ethics Statements
Interviews with Outstanding Authors
Newsroom
Sponsored Conferences
Podcast
Contact
Special Collections
Submit an Article
Online ISSN: 1945-4589
Research Paper
|
Volume 13, Issue 2
|
pp. 2640–2654
MiR-16-5p suppresses myofibroblast activation in systemic sclerosis by inhibiting NOTCH signaling
Back to article
Figure 2
(2 of 7)
−
100%
+
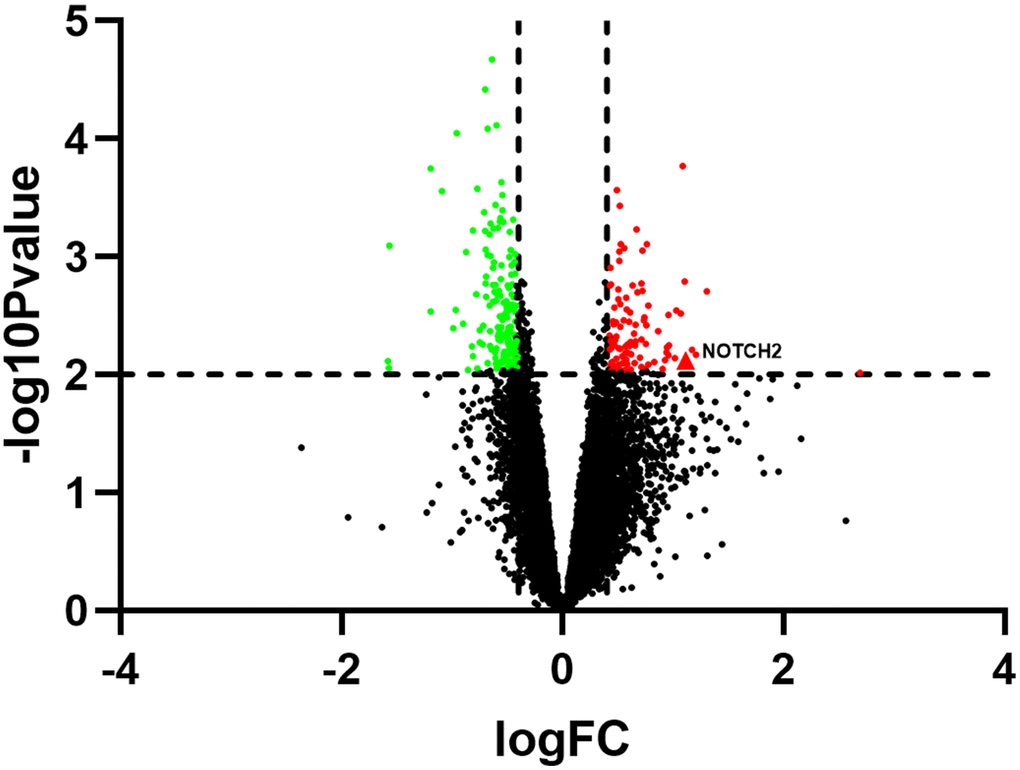
Figure 2.
Volcano plot showing differentially expressed genes in SSc patients compared to healthy controls (n=30 per group) in the GSE145120 dataset.