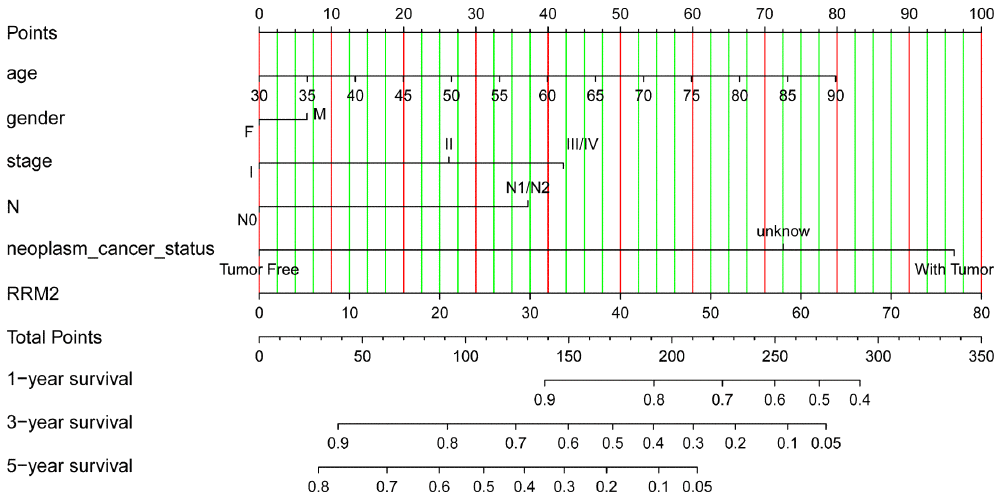
Figure 6.Nomogram for predicting probability of patients with 1-, 3- and 5-year overall survival. For risk estimation, identify the status for each clinical factors and expression value of RRM2, draw a line straight upwards to the Points axis to see the points a single factor yields. Repeat until scores for all factors are decided. Sum the points and locate the summed point on the Total Points axis. Then 1-, 3- and 5year related survival probabilities were obtained by draw a line straight down to the Risk axis.