Submit an Article
Navigate
Home
Editorial Board
Editorial Policies
Current Volume
Archive
Scientific Integrity
Publication Ethics Statements
Interviews with Outstanding Authors
Newsroom
Sponsored Conferences
Podcast
Contact
Special Collections
Submit an Article
Online ISSN: 1945-4589
Research Paper
|
Volume 13, Issue 3
|
pp. 3518–3535
High expression of RRM2 as an independent predictive factor of poor prognosis in patients with lung adenocarcinoma
Back to article
Figure 5
(5 of 11)
−
100%
+
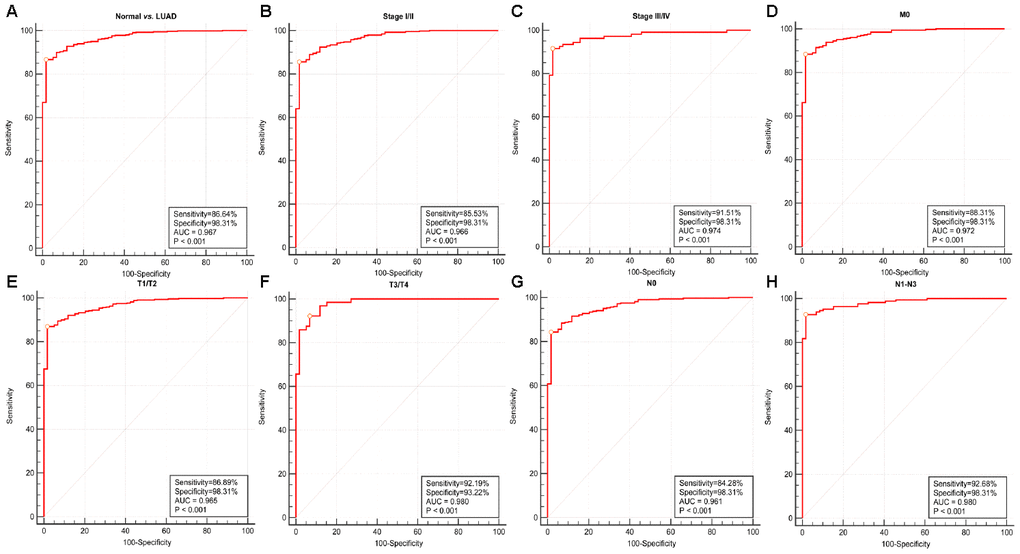
Figure 5.
Diagnostic value of RRM2 expression in lung adenocarcinoma.
(
A
) ROC curve for RRM2 in normal lung tissue and LUAD; (
B
–
H
) Subgroup analysis for stage I/II, stage III/IV, M0, T1/T2, T3/T4, N0, N1-N3.