Submit an Article
Navigate
Home
Editorial Board
Editorial Policies
Current Volume
Archive
Scientific Integrity
Publication Ethics Statements
Interviews with Outstanding Authors
Newsroom
Sponsored Conferences
Podcast
Contact
Special Collections
Submit an Article
Online ISSN: 1945-4589
Research Paper
|
Volume 13, Issue 2
|
pp. 2519–2538
Identification of key modules and genes associated with breast cancer prognosis using WGCNA and ceRNA network analysis
Back to article
Figure 6
(6 of 6)
−
100%
+
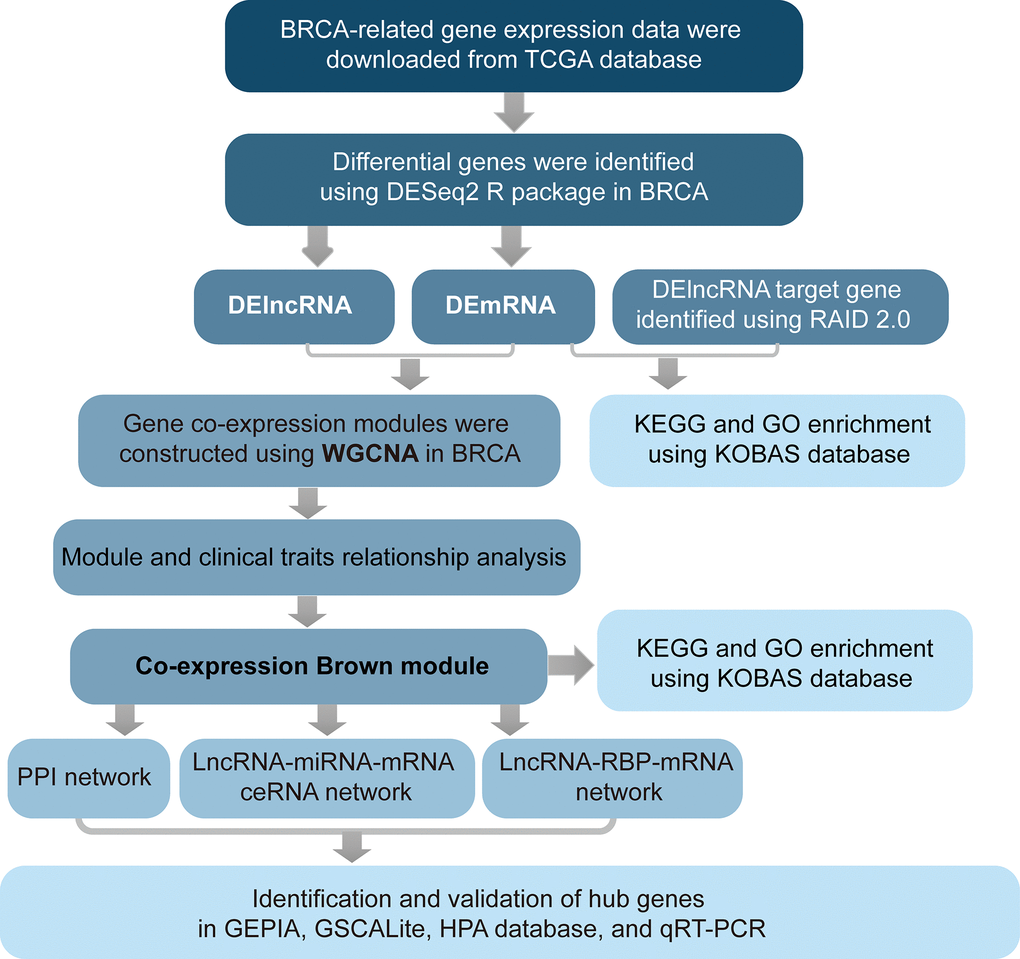
Figure 6.
Flow chart of analysis.