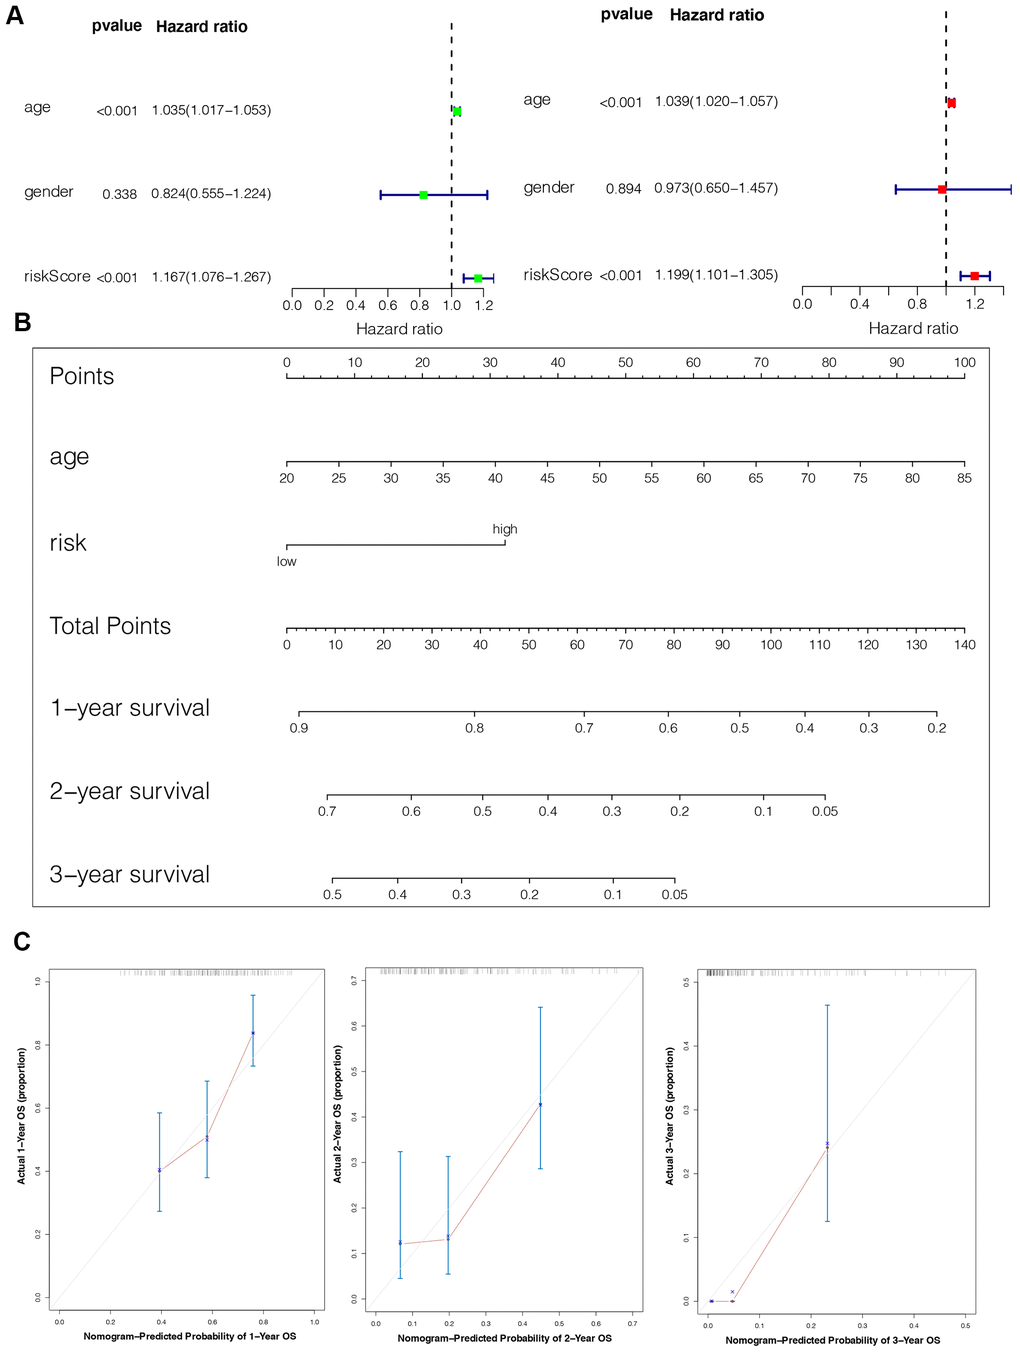
Figure 5.Construction of the nomogram model. (A) Univariate and multivariate Cox analyses indicating that the IPS is significantly associated with OS. (B) Nomogram model for predicting the probability of 1-, 2-, and 3-year OS in GBMs. (C) Calibration plots of the nomogram for predicting the probability of OS at 1, 2, and 3 years.