Submit an Article
Navigate
Home
Editorial Board
Editorial Policies
Current Volume
Archive
Scientific Integrity
Publication Ethics Statements
Interviews with Outstanding Authors
Newsroom
Sponsored Conferences
Podcast
Contact
Special Collections
Submit an Article
Online ISSN: 1945-4589
Research Paper
|
Volume 13, Issue 3
|
pp. 3459–3482
Exploration of the immune cell infiltration-related gene signature in the prognosis of melanoma
Back to article
Figure 5
(5 of 10)
−
100%
+
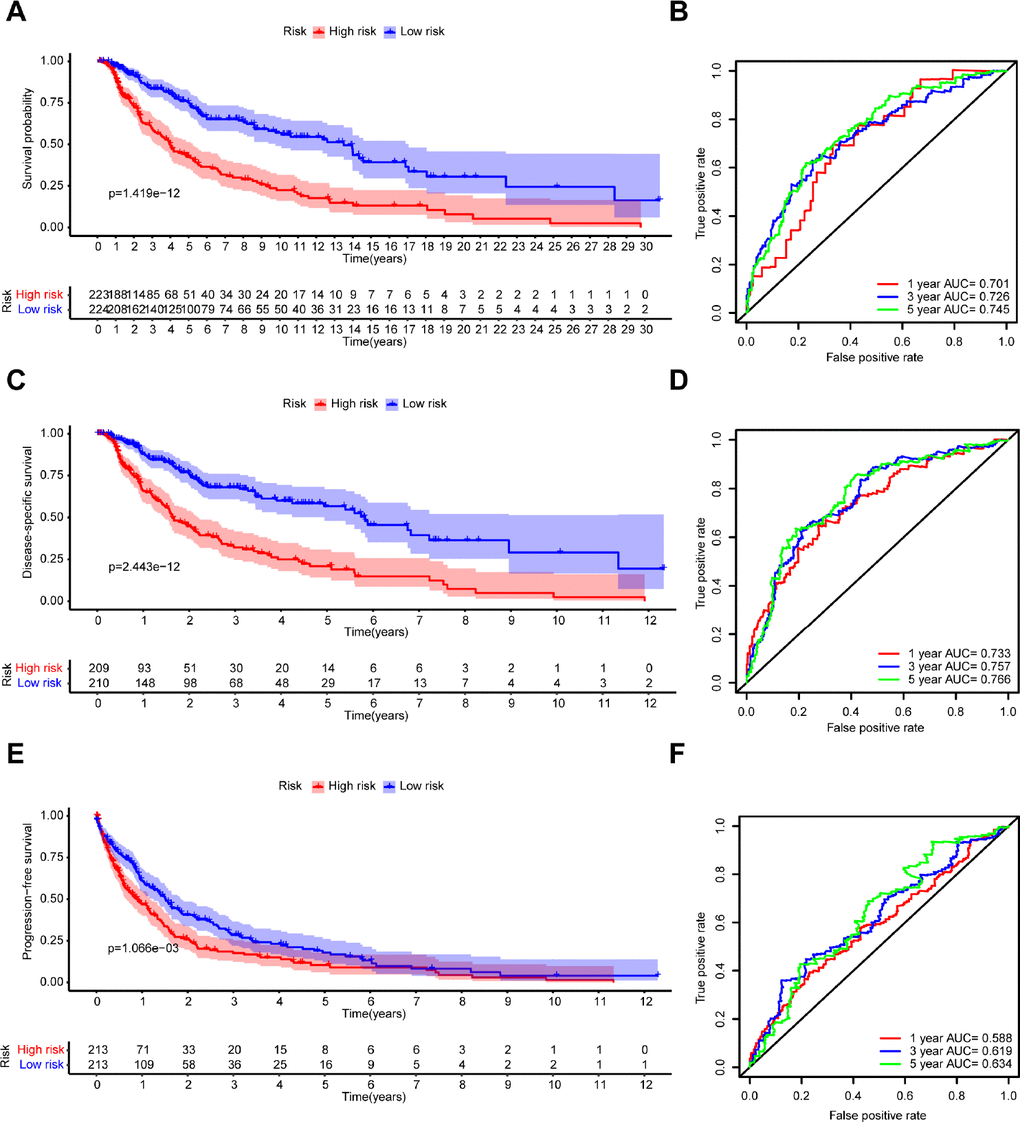
Figure 5.
Kaplan–Meier survival analysis and time-dependent ROC analysis of the 7-gene prognostic signature in the TCGA dataset.
Kaplan-Meier survival curves and ROC curves of (
A
,
B
) OS, (
C
,
D
) DSS, and (
E
,
F
) PFS in patients with melanoma.