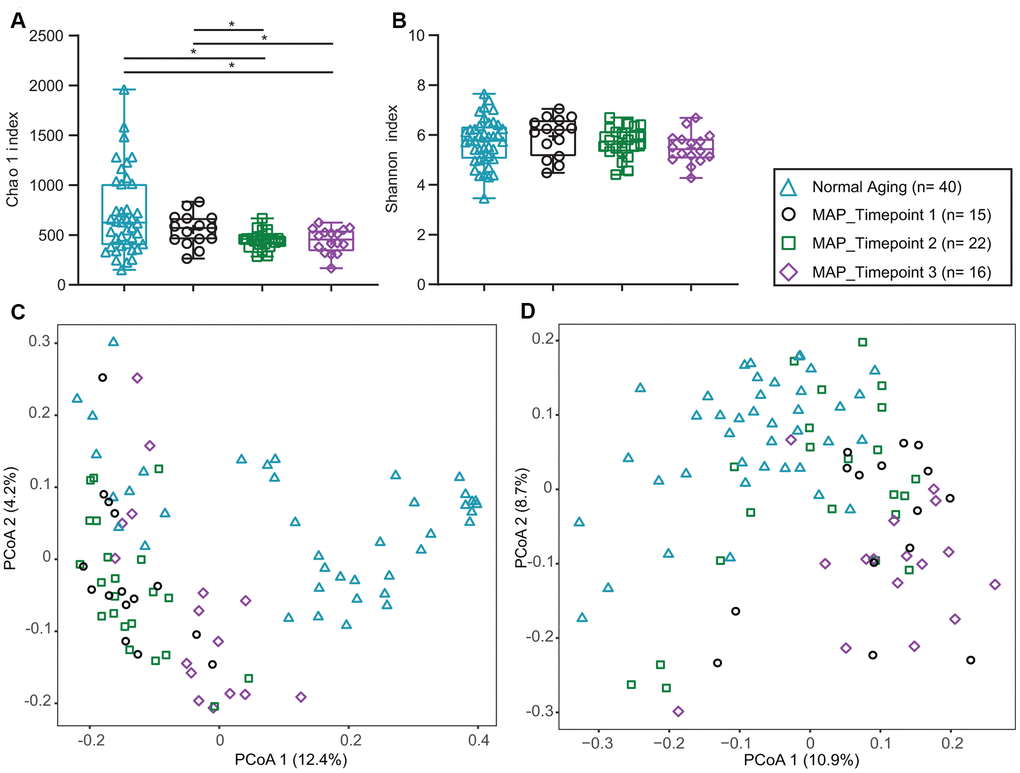
Figure 2.Alpha and beta diversity of Normal Aging and MAP groups. (A) Chao 1’s, (B) Shannon’s alpha diversity indexes comparing Normal Aging and three time points of MAP groups. p* values of Mann-Whitney U test described significant difference from each other at two-sided p values of 0.05. In each box plot, median line, + mean, upper and lower quartiles, upper and lower extremes and whiskers are presented. (C) Weighted (D) Unweighted Unifrac principal coordinates analysis (PCoA) for beta diversity comparing Normal Aging and three time points of MAP groups. The groups of the subjects are represented by four different color-coded symbols with sample size in parenthesis in the legend. MAP= Mindful Awareness Program.