Submit an Article
Navigate
Home
Editorial Board
Editorial Policies
Current Volume
Archive
Scientific Integrity
Publication Ethics Statements
Interviews with Outstanding Authors
Newsroom
Sponsored Conferences
Podcast
Contact
Special Collections
Submit an Article
Online ISSN: 1945-4589
Research Paper
|
Volume 13, Issue 2
|
pp. 2397–2417
Immune profile of the tumor microenvironment and the identification of a four-gene signature for lung adenocarcinoma
Back to article
Figure 6
(6 of 9)
−
100%
+
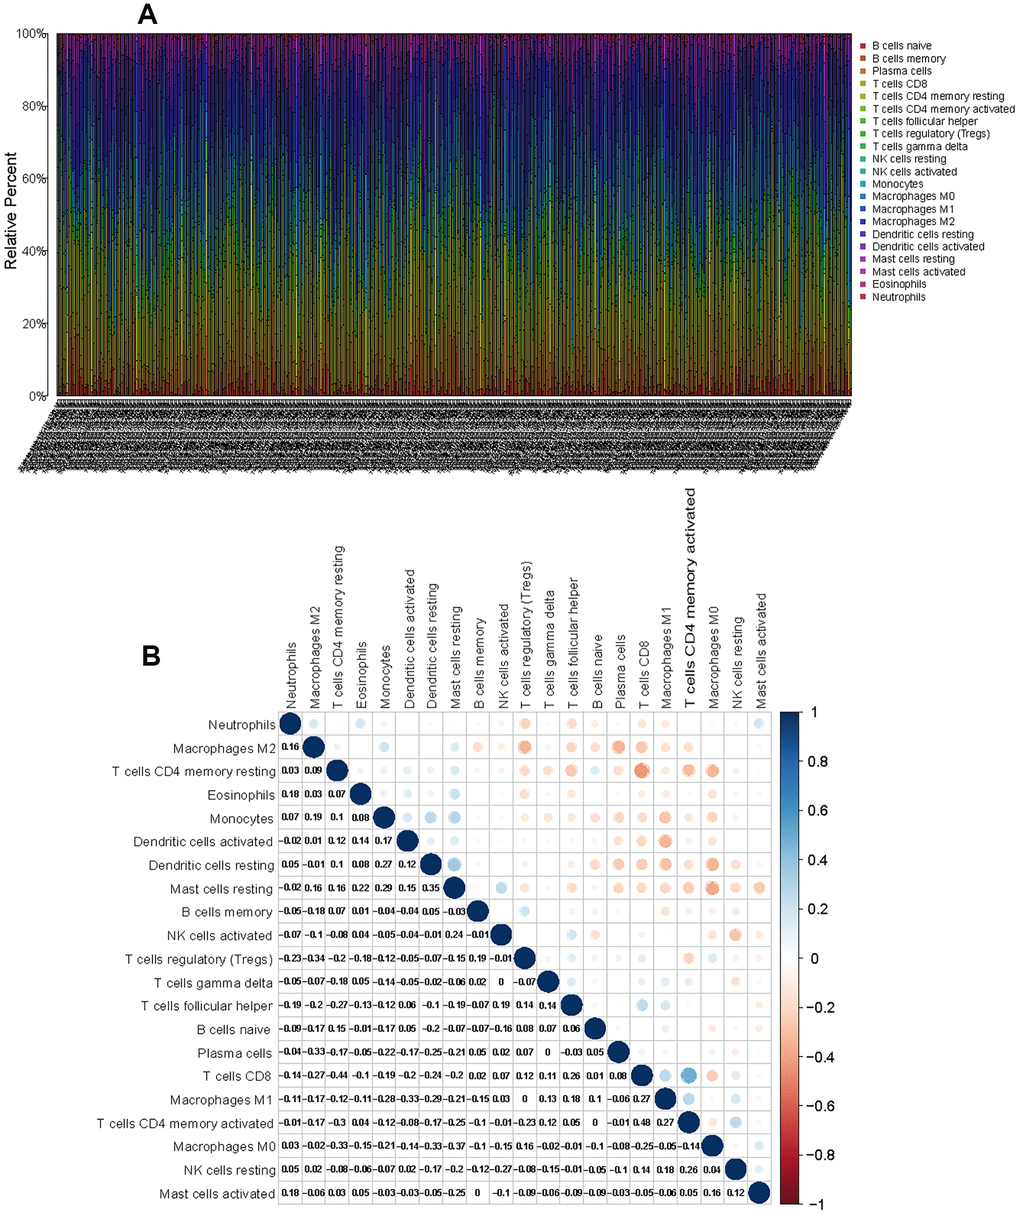
Figure 6.
CIBERSORT for estimating TIIC components in the LUAD microenvironment.
(
A
) Stacked bar chart representing the component of TIICs in LUAD samples. (
B
) Correlation matrix of the different tumor-infiltrating immune cell proportions in LUAD.